Monthly Archives: March 2022
Recipe 10: Writing Events to InfluxDB
Welcome to the last recipe of this Extended Events cookbook! You will find the first blog post of the series here and you can browse all recipes with the xesmarttarget tag on this blog.
The problem
The TIG software stack (Telegraf, InfluxDB, Grafana) is a very powerful combination of software tools that can help you collect, store and analyze data that has a time attribute. In particular, InfluxDB is a time series database, built with sharding, partitioning and retention policies in mind. It is absolutely fantastic for storing telemetry data, like performance counters from SQL Server or other software products.
In order to store data in InfluxDB, you can use Telegraf, a data collection agent that takes care of extracting telemetry data from the object to observe and upload it to the InfluxDB database. Telegraf is built with the concept of plugins: each object to observe has its own plugin and it’s not surprising at all to find a specialized plugin for SQL Server.
Using the SQL Server plugin, you can connect Telegraf to SQLServer, populate an InfluxDB database and visualize the performance metrics using Grafana. In fact, there are multiple readily available dashboards designed for the data collected by the Telegraf plugin for SQL Server. You can simply download and install those dashboards or build your custom dashboards to create a complete monitoring solution for SQL Server.
However, Telegraf is designed to pull data from SQL Server at regular intervals and cannot receive events from Extended Events sessions. Fortunately, there is a way around this limitation, using XESmartTarget and the TelegrafAppenderResponse.
This response type doesn’t work like the other ones: it connects to an Extended Events session and outputs the events it receives on STDOUT, using the Line Protocol format used by Telegraf. It is designed to be used in combination with Telegraf: it’s Telegraf itself that starts XESmartTarget and then listens to its STDOUT to produce the points to upload to InfluxDB.
It sounds complicated, but it is not. Let me show you how it works with an example.
In this case, we are going to capture the following events to upload them to InfluxDB: errors, timeout, blocking and deadlocking. Let’s do this!
The session
Of course, we need a session. It is going to contain all the four events that we need:
IF NOT EXISTS (SELECT * FROM sys.server_event_sessions WHERE name = 'Recipe10')

CREATE EVENT SESSION [Recipe10] ON SERVER
    ADD EVENT sqlserver.blocked_process_report (
        ACTION(
            package0.event_sequence,
            sqlserver.client_app_name,
            sqlserver.client_hostname,
            sqlserver.database_name,
            sqlserver.server_instance_name,
            sqlserver.server_principal_name,
            sqlserver.session_id,
            sqlserver.sql_text
        )
    )
,ADD EVENT sqlserver.error_reported (
        ACTION(
            package0.event_sequence,
            sqlserver.client_app_name,
            sqlserver.client_hostname,
            sqlserver.database_name,
            sqlserver.server_instance_name,
            sqlserver.server_principal_name,
            sqlserver.session_id
        )
        WHERE ([severity] >= (16))
    )
,ADD EVENT sqlserver.rpc_completed (
        ACTION(
            package0.event_sequence,
            sqlserver.client_app_name,
            sqlserver.client_hostname,
            sqlserver.database_name,
            sqlserver.query_hash,
            sqlserver.server_instance_name,
            sqlserver.server_principal_name,
            sqlserver.session_id
        )
        WHERE ([result] = (2))
    )
,ADD EVENT sqlserver.sql_batch_completed (
        ACTION(
            package0.event_sequence,
            sqlserver.client_app_name,
            sqlserver.client_hostname,
            sqlserver.database_name,
            sqlserver.query_hash,
            sqlserver.server_instance_name,
            sqlserver.server_principal_name,
            sqlserver.session_id
        )
        WHERE ([result] = (2))
    )
,ADD EVENT sqlserver.xml_deadlock_report (
        ACTION(
            package0.event_sequence,
            sqlserver.client_app_name,
            sqlserver.client_hostname,
            sqlserver.database_name,
            sqlserver.server_instance_name,
            sqlserver.server_principal_name,
            sqlserver.session_id
        )
);

IF NOT EXISTS (SELECT * FROM sys.dm_xe_sessions WHERE name = 'Recipe10')
    ALTER EVENT SESSION Recipe10 ON SERVER STATE = START;
GO
Let’s have a look at the script.
The errors are captured by the error_reported event, with a filter for severe errors (severity > 16).
The blocked_process_report event takes care of blocking. To make it work, you will have to configure the blocked process threshold configuration option.
Xml_deadlock_report captures all the deadlocks.
The timeouts are captured by rpc_completed and sql_batch_completed events with filter for result = 2 (error). It’s not only timeouts, but a large chunk of these are timeouts.
XESmartTarget
Now that we have a session, we need to provide the configuration for XESmartTarget.
{
    "Target": {
        "ServerName": "$ServerName",
        "SessionName": "Recipe10",
        "FailOnProcessingError": false,
        "Responses": [
            {
                "__type": "TelegrafAppenderResponse",
                "Events": [
                    "error_reported"
                ],
                "OutputMeasurement": "sqlserver_events_errors",
                "OutputTags": [
                    "server_instance_name",
                    "name",
                    "client_app_name",
                    "server_principal_name",
                    "client_hostname",
                    "database_name",
                    "severity",
                    "error_number"
                ],
                "OutputFields": [
                    "event_sequence",
                    "message"
                ]
            },
            {
                "__type": "TelegrafAppenderResponse",
                "Events": [
                    "sql_batch_completed"
                ],
                "OutputMeasurement": "sqlserver_events_timeouts",
                "OutputTags": [
                    "server_instance_name",
                    "name",
                    "client_app_name",
                    "server_principal_name",
                    "client_hostname",
                    "database_name"
                ],
                "OutputFields": [
                    "event_sequence",
                    "sql_text AS batch_text",
                    "cpu_time",
                    "duration",
                    "logical_reads",
                    "physical_reads",
                    "writes",
                    "query_hash",
                    "row_count"
                ]
            },
            {
                "__type": "TelegrafAppenderResponse",
                "Events": [
                    "rpc_completed"
                ],
                "OutputMeasurement": "sqlserver_events_timeouts",
                "OutputTags": [
                    "server_instance_name",
                    "name",
                    "client_app_name",
                    "server_principal_name",
                    "client_hostname",
                    "database_name"
                ],
                "OutputFields": [
                    "event_sequence",
                    "sql_text AS statement",
                    "cpu_time",
                    "duration",
                    "logical_reads",
                    "physical_reads",
                    "writes",
                    "query_hash",
                    "row_count"
                ]
            },
            {
                "__type": "TelegrafAppenderResponse",
                "Events": [
                    "xml_deadlock_report"
                ],
                "OutputMeasurement": "sqlserver_events_deadlocks",
                "OutputTags": [
                    "server_instance_name",
                    "name",
                    "client_app_name",
                    "server_principal_name",
                    "client_hostname",
                    "database_name"
                ],
                "OutputFields": [
                    "event_sequence",
                    "session_id",
                    "xml_report"
                ]
            },
            {
                "__type": "TelegrafAppenderResponse",
                "Events": [
                    "blocked_process_report"
                ],
                "OutputMeasurement": "sqlserver_events_blocking",
                "OutputTags": [
                    "server_instance_name",
                    "name",
                    "client_app_name",
                    "server_principal_name",
                    "client_hostname",
                    "database_name"
                ],
                "OutputFields": [
                    "event_sequence",
                    "blocked_process",
                    "duration",
                    "index_id",
                    "lock_mode",
                    "object_id",
                    "resource_owner_type",
                    "transaction_id"
                ]
            }
        ]
    }
}
OutputMeasurement indicates the name of the measurement (that’s the equivalent of a table in InfluxDB). OutputTags and OutputFields indicate which “columns” will be added to the measurement. In InfluxDB you don’t have tables and you don’t have columns, but each point (that’s the equivalent of a row) has attributes of two types: tags (these are the key attributes, which are indexed) and fields (these are the value attributes, that contain the data).
The combination of timestamp + tags must be unique: if you send a point with the same tag values and the same timestamp as an existing point in the measurement, the existing point gets overwritten.
For instance, you could have a point with timestamp + tags (database name) and fields (data size, log size). Tags are indexed and are used to locate the points and aggregate them, while fields usually contain the numeric attributes that can be plotted on a chart or aggregated before visualizing.
In this configuration, XESmartTarget is not started directly by you, but it is started by Telegraf, using the execd plugin. Telegraf itself needs its configuration file, which looks like this:
# Telegraf Configuration
#

# Configuration for telegraf agent
[agent]

  interval = "15s"
  round_interval = true

  metric_batch_size = 5000
  metric_buffer_limit = 15000

  collection_jitter = "0s"

  flush_interval = "10s"
  flush_jitter = "0s"

  ## By default or when set to "0s", precision will be set to the same timestamp order as the collection interval, with the maximum being 1s. (interval = "10s", precision = "1s")
  ## Valid time units are "ns", "us" (or "┬╡s"), "ms", "s".
  precision = "1s"

  ## Log
  debug = true
  quiet = false

  ##  empty string means to log to stderr.
  logfile = "C:\\temp\\telegraf_log.log"

  logfile_rotation_interval = "7d"
  logfile_rotation_max_size = "50MB"
  logfile_rotation_max_archives = 7

  ## Add tag "host" to every collected metric, the host is the machine on which telegraf runs
  ## Override default hostname, if empty use os.Hostname()
  hostname = ""
  ## If set to true, do no set the "host" tag in the telegraf agent.
  omit_hostname = false

[[inputs.execd]]
  command = [
    'powershell',
    '-File',
    'C:\temp\Recipe_10_telegraf_xesmarttarget.ps1',
    '-ServerName',
    'localhost\SQLEXPRESS'
  ]
  signal = "none"
  restart_delay = "2m"
  data_format = "influx"


  [[processors.strings]]

  namepass = ["sqlserver_events_*"]

    [[processors.strings.replace]]


    tag = "server_instance_name"
    old = "\\"
    new = ":"

# Configuration for sending metrics to InfluxDB
[[outputs.influxdb]]

  urls = ["https://localhost:8086"]

  # database = ""
  database_tag = "demo"
  exclude_database_tag = false

  skip_database_creation = true

  # retention_policy = ""
  # retention_policy_tag = ""
  # exclude_retention_policy_tag = false

  # write_consistency = "any"

  ## Timeout for HTTP messages.
  timeout = "5s"

  ## HTTP User-Agent
  # user_agent = "telegraf"

  ## HTTP Content-Encoding for write request body, can be set to "gzip" to
  ## compress body or "identity" to apply no encoding.
  content_encoding = "gzip"
Save this as c:\temp\telegraf.conf. As you can see from the telegraf configuration file, it has to start a powershell script that in turn takes care of running XESmartTarget. The script is super simple and it looks like this:
[CmdletBinding()]
Param(
  [Parameter(Mandatory=$True,Position=0)]
  [string]$ServerName
)

$params = $(
    "--File",
    "$PsScriptRoot\Recipe_10_Telegraf.json",
    "--NoLogo",
    "--Quiet",
    "--GlobalVariables",
    "ServerName=$ServerName"
)


& "C:\Program Files\XESmartTarget\XESmartTarget.exe" $Params

exit 1
You can save it as C:\temp\Recipe_10_telegraf_xesmarttarget.ps1 and start Telegraf, using the configuration file provided.
The syntax for that is the following:
Telegraf.exe --config c:\temp\telegraf.confTelegraf will not show much on its console window, but under the hood it is starting XESmartTarget and it receives all the events in Line Protocol format from the TelegrafAppenderResponse.
You can set up a dashboard to display all the data, like this one from QMonitor, the monitoring solution built by Quantumdatis. QMonitor is built on top of the TIG stack and uses multiple components, including XESmartTarget, to extract, upload and analyze SQL Server performance data.
The events dashboard looks like this:

If you click one of the events, you can see the details of the event. In this case, the dashboard displays data about deadlocks:
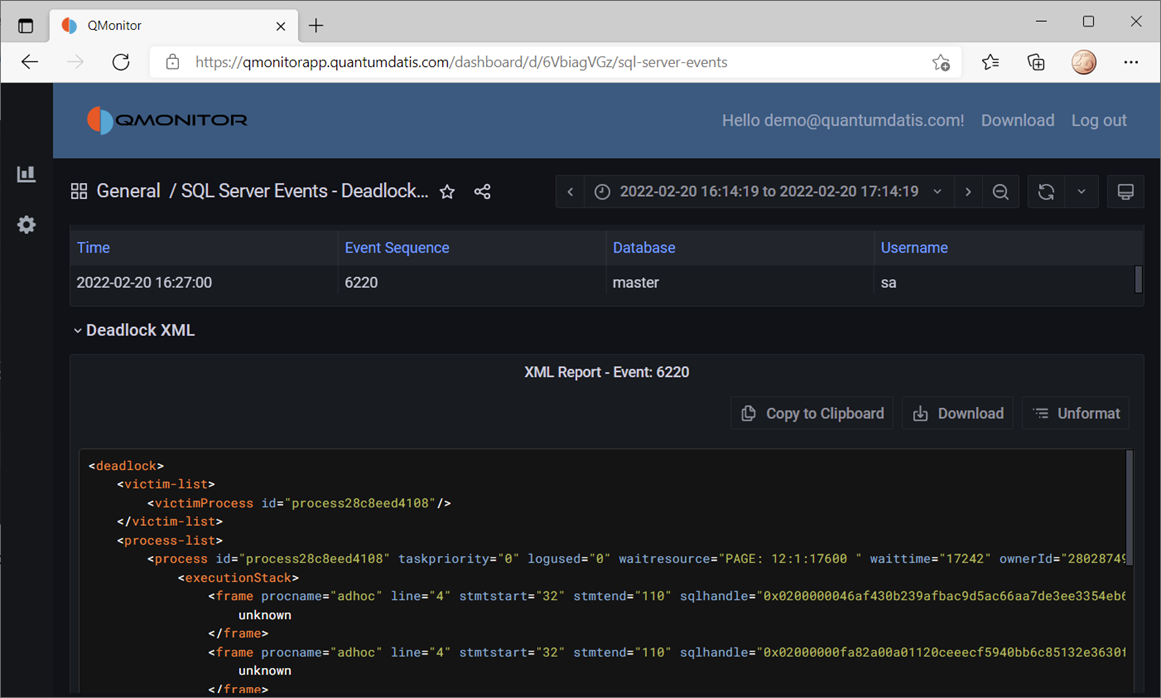
All the data on this dashboard comes from the events captured by XESmartTarget and uploaded to InfluxDB by Telegraf.
Recap
Thanks to XESmartTarget it is extremely easy to capture events and process them with very little effort. You can perform a great variety of tasks with XEsmartTarget, from writing to a table in the database to the most complex tasks, like aggregating data in memory or sending emails.
You can review all the posts in the series, browsing the XESmartTarget tag. If you have questions on XESmartTarget don’t be shy and send me an email or comment here. Thanks for your attention!
Recipe 9: Capturing Queries and Plans
Welcome to a new recipe of this Extended Events cookbook! You will find the first blog post of the series here and you can browse all recipes with the xesmarttarget tag on this blog.
The problem
In the previous recipe we used XESmartTarget to analyze a workload and we could characterize it by application/login/database. Now let’s take one more step: let’s capture all the queries and their plans and add query_hash and query_plan_hash to the analysis table. We will also capture plans and query text on separate tables.
The session
The session looks a bit like the one that we had for the previous recipe, but the events are different.
IF NOT EXISTS ( SELECT * FROM sys.server_event_sessions WHERE name = 'Recipe09')

CREATE EVENT SESSION [Recipe09] ON SERVER
ADD EVENT sqlserver.sp_statement_completed(
	SET collect_statement=(1)
    ACTION(
		sqlserver.client_app_name,
		sqlserver.client_hostname,
		sqlserver.database_name,
		sqlserver.plan_handle,
		sqlserver.query_hash,
		sqlserver.query_plan_hash,
		sqlserver.server_principal_name
	)
    WHERE ([sqlserver].[query_hash] <> 0)
),
ADD EVENT sqlserver.sql_statement_completed(
	SET collect_statement=(1)
    ACTION(
		sqlserver.client_app_name,
		sqlserver.client_hostname,
		sqlserver.database_name,
		sqlserver.plan_handle,
		sqlserver.query_hash,
		sqlserver.query_plan_hash,
		sqlserver.server_principal_name
	)
    WHERE ([sqlserver].[query_hash] <> 0)
)
GO

IF NOT EXISTS ( SELECT * FROM sys.dm_xe_sessions WHERE name = 'Recipe09')
    ALTER EVENT SESSION Recipe09 ON SERVER STATE = START;
This time, instead of capturing sql_batch_completed and rpc_completed, we have to capture sql_statement_completed and sp_statement_completed. This is because we have to capture events that carry the plan_handle, query_hahs and query_plan_hash columns, that are available on the individual statements rather than the whole batches or stored procedures.
XESmartTarget
First, we need to create some tables to store the data captured by the session:
CREATE TABLE [dbo].[Recipe_09_WorkloadAnalysis](
	[snapshot_id] [datetime2](7) NULL,
	[client_app_name] [nvarchar](255) NULL,
	[server_principal_name] [nvarchar](128) NULL,
	[database_name] [nvarchar](128) NULL,
	[query_hash] [decimal](20, 0) NULL,
	[query_plan_hash] [decimal](20, 0) NULL,
	[tot_cpu] [bigint] NULL,
	[tot_duration] [bigint] NULL,
	[tot_reads] [bigint] NULL,
	[tot_writes] [bigint] NULL,
	[execution_count] [bigint] NULL,
	CONSTRAINT UQ_Recipe_09_WorkloadAnalysis
		UNIQUE (snapshot_id, client_app_name, server_principal_name, database_name, query_hash, query_plan_hash)

)

CREATE TABLE [dbo].[Recipe_09_WorkloadAnalysis_Queries](
	[query_hash] [numeric](20, 0) PRIMARY KEY,
	[sql_text] [nvarchar](max) NULL
)

CREATE TABLE [dbo].[Recipe_09_WorkloadAnalysis_Plans](
	[query_plan_hash] [numeric](20, 0) PRIMARY KEY,
	[query_plan] [xml] NULL
)
The target configuration is rather complex: we have three tables to populate, so we need three separate Responses.
{
    "Target": {
        "ServerName": "$ServerName",
        "SessionName": "Recipe09",
        "FailOnProcessingError": false,
        "Responses": [
            {
                "__type": "GroupedTableAppenderResponse",
                "ServerName": "$ServerName",
                "DatabaseName": "XERecipes",
                "TableName": "Recipe_09_WorkloadAnalysis",
                "AutoCreateTargetTable": false,
                "OutputColumns": [
                    "snapshot_id AS CONVERT(SUBSTRING(CONVERT(collection_time,'System.String'),1,16),'System.DateTime')",
                    "client_app_name",
                    "server_principal_name",
                    "database_name",
                    "query_hash",
                    "query_plan_hash",
                    "SUM(cpu_time) AS tot_cpu",
                    "SUM(duration) AS tot_duration",
                    "SUM(logical_reads) AS tot_reads",
                    "SUM(writes) AS tot_writes",
                    "COUNT(collection_time) AS execution_count"
                ]
            },
            {
                "__type": "GroupedTableAppenderResponse",
                "ServerName": "$ServerName",
                "DatabaseName": "XERecipes",
                "TableName": "Recipe_09_WorkloadAnalysis_Queries",
                "AutoCreateTargetTable": false,
                "OutputColumns": [
                    "query_hash",
                    "MIN(statement) AS sql_text"
                ]
            },
            {
                "__type": "ExecuteTSQLResponse",
                "ServerName": "$ServerName",
                "DatabaseName": "XERecipes",
                "TSQL": "INSERT INTO Recipe_09_WorkloadAnalysis_Plans SELECT TOP(1) {query_plan_hash} AS query_plan_hash, query_plan FROM sys.dm_exec_query_plan({plan_handle}) AS qp WHERE NOT EXISTS(SELECT * FROM Recipe_09_WorkloadAnalysis_Plans WITH (READCOMMITTEDLOCK) WHERE query_plan_hash = {query_plan_hash})"
            }
        ]
    }
}
The first Response takes care of aggregating the data, as we did for the previous recipe. This time we have some more columns to group on (query_hash and query_plan_hash), but it’s rather similar to what we did last time.
The second Response saves the text of the queries by query hash. We can safely use MIN(statement) to make sure that we capture one instance of the query text for each plan_hash.
The third Response captures the query plans. Instead of capturing the plan from the session, we’re extracting it from sys.dm_exec_query_plan. I’m not really sure this is a great idea from a performance standpoint, but I’m just demonstrating a concept here: I strongly suggest that you measure the impact before running this against a production server.
OK, let’s save the configuration and start XESmartTarget:
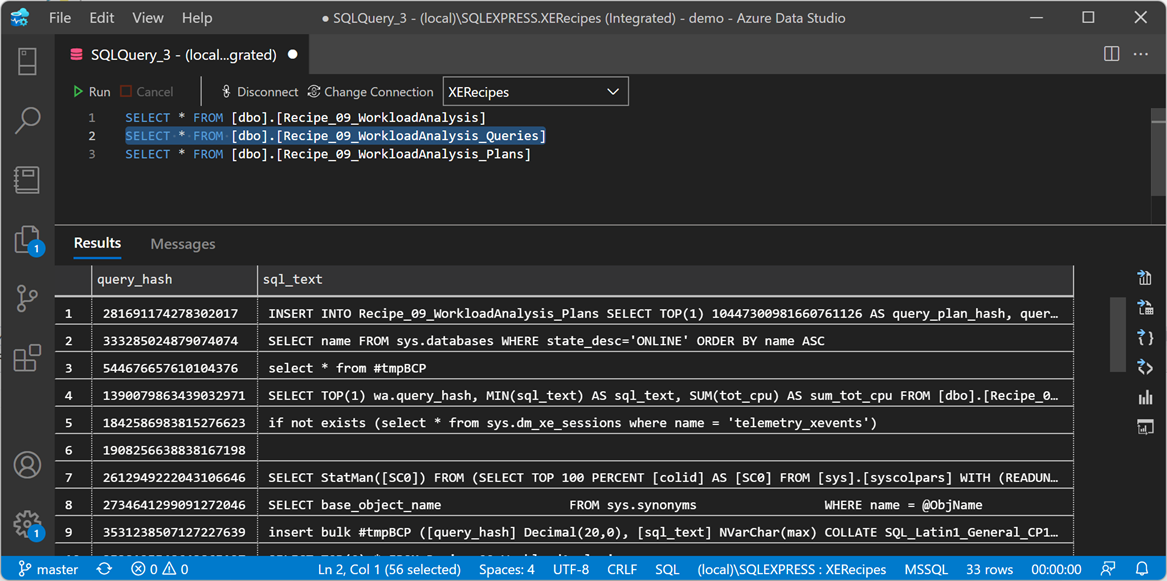
"%ProgramFiles%\XESmartTarget\xesmarttarget.exe" --File C:\temp\Recipe_09_Workload_Analysis.json --GlobalVariables ServerName=(local)\SQLEXPRESSAfter a while, we can inspect the data in the target tables. As expected, the first one contains the workload data:

The second table contains all the queries:
And the last one contains all the query plans:

Using this data, we can easily identify the most cpu intensive queries, using this statement:
SELECT TOP(10) wa.query_hash, MIN(sql_text) AS sql_text, SUM(tot_cpu) AS sum_tot_cpu
FROM [dbo].[Recipe_09_WorkloadAnalysis] AS wa
INNER JOIN [dbo].[Recipe_09_WorkloadAnalysis_Queries] AS q
	ON wa.query_hash = q.query_hash
GROUP BY wa.query_hash
ORDER BY sum_tot_cpu DESC

There is not much going on on this instance, but still the query to extract plans tops the chart. Hmmm… it looks like extracting query plans this way is probably not a great idea after all 🙂
Recap
Combining multiple Response types, you can achieve very complex results. XESmartTarget can be a life saver when you have to pull event data from many events and manipulate the data in many ways.
In the next recipe we will see how to write events to a time-series database like InfluxDB, using XESmartTarget and the TelegrafAppenderResponse. Keep an eye on the XESmartTarget tag!
Recipe 8: Analyzing a Workload
Welcome to a new recipe of this Extended Events cookbook! You will find the first blog post of the series here and you can browse all recipes with the xesmarttarget tag on this blog.
The problem
The idea comes from a blog post by Brent Ozar about “How to Find Out Whose Queries are Using The Most CPU“. Brent uses the Resource Governor to detect who’s using the CPU. That’s an interesting approach, but you can do the same more efficiently with XESmartTarget.
Analyzing a workload means capturing all the queries on a server, categorize them by application name, database name and login name, and creating samples at regular intervals, in order to describe the behavior of the workload over time, let’s say every one minute.
The session
The events that you need this time are rpc_completed and sql_batch_completed. These two events are enough to describe the workload. Here is what the session script looks like:
IF NOT EXISTS ( SELECT * FROM sys.server_event_sessions WHERE name = 'Recipe08')

CREATE EVENT SESSION [Recipe08] ON SERVER
ADD EVENT sqlserver.rpc_completed(
    ACTION(
        package0.event_sequence,
        sqlserver.client_app_name,
        sqlserver.client_pid,
        sqlserver.database_name,
        sqlserver.nt_username,
        sqlserver.server_principal_name,
        sqlserver.session_id
    )
    WHERE ([package0].[equal_boolean]([sqlserver].[is_system],(0)))
),
ADD EVENT sqlserver.sql_batch_completed(
    ACTION(
        package0.event_sequence,
        sqlserver.client_app_name,
        sqlserver.client_pid,
        sqlserver.database_name,
        sqlserver.nt_username,
        sqlserver.server_principal_name,
        sqlserver.session_id
    )
    WHERE ([package0].[equal_boolean]([sqlserver].[is_system],(0)))
)
GO

IF NOT EXISTS ( SELECT * FROM sys.dm_xe_sessions WHERE name = 'Recipe08')
    ALTER EVENT SESSION Recipe08 ON SERVER STATE = START;
XESmartTarget
This is what the configuration looks like:
{
    "Target": {
        "ServerName": "$ServerName",
        "SessionName": "Recipe08",
        "FailOnProcessingError": false,
        "Responses": [
            {
                "__type": "GroupedTableAppenderResponse",
                "ServerName": "$ServerName",
                "DatabaseName": "XERecipes",
                "TableName": "Recipe_08_WorkloadAnalysis",
                "AutoCreateTargetTable": false,
                "OutputColumns": [
                    "snapshot_id AS CONVERT(SUBSTRING(CONVERT(collection_time,'System.String'),1,16),'System.DateTime')",
                    "client_app_name",
                    "server_principal_name",
                    "database_name",
                    "SUM(cpu_time) AS tot_cpu",
                    "SUM(duration) AS tot_duration",
                    "SUM(logical_reads) AS tot_reads",
                    "SUM(writes) AS tot_writes",
                    "COUNT(collection_time) AS execution_count"
                ],
                "Events": [
                    "rpc_completed",
                    "sql_batch_completed"
                ]
            }
        ]
    }
}
We used the GroupedTableAppender before, but this time we are grouping data using an Expression Column as part of the GROUP BY columns, in order to get a date column with precision up to the minute, to use as a snapshot_id. The expression converts the column “collection_time” (it’an automatic column, added by XESmartTarget to all the events captured) from DateTime to String, removing the last two digits (the seconds). The conversion depends on a weird combination of the short date and long time formats:

In this case, the snapshot_id will be in the format dd-MM-yyyy HH:mm:ss, so taking the first 16 characters, as the SUBSTRING function here does, returns dd-MM-yyyy HH:mm, for instance 18-02-2022 10:15. If you’re using a different format, make sure you’re changing the expression accordingly. Converting it back to System.DateTime ensures that you get a proper datetime2 column that you can sort on.
Before starting XESmartTarget, you’d better create the target table manually:
CREATE TABLE [dbo].[Recipe_08_WorkloadAnalysis](
	[snapshot_id] [datetime2](7) NULL,
	[client_app_name] [nvarchar](255) NULL,
	[server_principal_name] [nvarchar](128) NULL,
	[database_name] [nvarchar](128) NULL,
	[tot_cpu] [bigint] NULL,
	[tot_duration] [bigint] NULL,
	[tot_reads] [bigint] NULL,
	[tot_writes] [bigint] NULL,
	[execution_count] [bigint] NULL,
	CONSTRAINT UQ_Recipe_08_WorkloadAnalysis
		UNIQUE (snapshot_id, client_app_name, server_principal_name, database_name)
)
Now that the table is ready, you can save the configuration file and start XESmartTarget:
"%ProgramFiles%\XESmartTarget\xesmarttarget.exe" --File c:\temp\Recipe_08_WorkloadAnalysis.json --GlobalVariables ServerName=(local)\SQLEXPRESSLet’s leave this running for a while and have a look at the data in the target table:

To answer the question in Brent’s post, Whose Queries are Using The Most CPU? Let’s find out! Turns out it’s me (surprise!):

Not only I can analyze the workload as a whole, but I can also plot cpu usage by database or login or application in a chart like this:

Well, maybe Azure Data Studio is probably not the best tool for the job, but you can use something like Grafana to plot the data.
Recap
GroupedTableAppenderResponse is a super powerful tool! It can group on Expression Columns and can be incredibly helpful when you have to summarize event data over time.
In the next recipe we will see how to take GroupedTableAppenderResponse to the next level and simulate what Query Store does (especially useful if you’re not on 2016 or later). Keep an eye on the XESmartTarget tag!
Recipe 7: Finding Unused Tables
Welcome toa new recipe of this Extended Events cookbook! You will find the first blog post of the series here and you can browse all recipes with the xesmarttarget tag on this blog.
The problem
The previous recipe showed you how to capture data from Extended Events sessions, summarize it in memory and then save it to a table in SQL Server, merging with any existing rows. This comes extremely handy when the events are not useful individually, but when the story is told by the aggregation of all the events.
Another possible problem that can be solved with the same technique is finding unused objects in the database. It looks like a trivial problem, but it’s not.
The easiest way to determine if a table is used or not is… deleting it and waiting for users to complain 🙂 Of course, the easiest method is not always the most appropriate, and this makes no exception.
Audits would be extremely useful for this, because they capture the right events. Unfortunately they suffer from the same limitation discussed in the previous recipe: you don’t need the individual audit entries, all you need is a counter of accesses to the table. Again, GroupedTableAppenderResponse has got you covered.
The session
The session for this recipe is going to be a bit weird. Instead of capturing the audit events, you’ll have to use a different type of event. The audit events are private and can only be used by the audit feature, so you need to track something else.
The lock_acquired events seem to have everything that you need: every time a table is accessed, a lock on the table is placed, so you can track them and determine whether the table is used or not. Let’s create a session:
IF NOT EXISTS ( SELECT * FROM sys.server_event_sessions WHERE name = 'Recipe07')

CREATE EVENT SESSION [Recipe07] ON SERVER
ADD EVENT sqlserver.lock_acquired (
    SET collect_database_name = (0)
        ,collect_resource_description = (1)
    ACTION(sqlserver.client_app_name, sqlserver.is_system, sqlserver.server_principal_name)
    WHERE (
        [package0].[equal_boolean]([sqlserver].[is_system], (0)) -- user SPID
        AND [package0].[equal_uint64]([resource_type], (5)) -- OBJECT
        AND [package0].[not_equal_uint64]([database_id], (32767))  -- resourcedb
        AND [package0].[greater_than_uint64]([database_id], (4)) -- user database
        AND [package0].[greater_than_equal_int64]([object_id], (245575913)) -- user object
        AND (
               [mode] = (1) -- SCH-S
            OR [mode] = (6) -- IS
            OR [mode] = (8) -- IX
            OR [mode] = (3) -- S
            OR [mode] = (5) -- X
        )
    )
);
GO


IF NOT EXISTS ( SELECT * FROM sys.dm_xe_sessions WHERE name = 'Recipe07')
    ALTER EVENT SESSION Recipe07 ON SERVER STATE = START;
XESmartTarget
The configuration takes advantage of the capabilities of GroupedTableAppenderResponse: the events are processed by two separate Responses and merged into the same target table. The first Response only takes care of reads, while the second Response takes care of writes.
{
    "Target": {
        "ServerName": "$ServerName",
        "SessionName": "Recipe07",
        "FailOnProcessingError": false,
        "Responses": [
            {
                "__type": "GroupedTableAppenderResponse",
                "ServerName": "$ServerName",
                "DatabaseName": "XERecipes",
                "TableName": "Recipe_07_TableAudit",
                "AutoCreateTargetTable": false,
                "OutputColumns": [
                    "client_app_name",
                    "database_id",
                    "object_id",
                    "MAX(collection_time) AS last_read"
                ],
                "Events": [
                    "lock_acquired"
                ],
                "Filter": "mode NOT IN ('X','IX')"
            },
            {
                "__type": "GroupedTableAppenderResponse",
                "ServerName": "$ServerName",
                "DatabaseName": "XERecipes",
                "TableName": "Recipe_07_TableAudit",
                "AutoCreateTargetTable": false,
                "OutputColumns": [
                    "client_app_name",
                    "database_id",
                    "object_id",
                    "MAX(collection_time) AS last_write"
                ],
                "Events": [
                    "lock_acquired"
                ],
                "Filter": "mode IN ('X','IX')"
            }
        ]
    }
}
Let’s save the JSON file as c:\temp\Recipe_07_Table_Audit.json.
Before you can run XESmartTarget, you need to create the target table with this script:
USE [XERecipes]
GO

CREATE TABLE [dbo].[Recipe_07_TableAudit](
	[client_app_name] [nvarchar](255) NULL,
	[database_id] [int] NULL,
	[object_id] [int] NULL,
	[last_read] [datetime2](7) NULL,
	[last_write] [datetime2](7) NULL
) ON [PRIMARY]
GO
If you don’t create the table upfront, XESmartTarget will try to create it, but the first Response that hits the database will do that and, in this case, you have different responses with different sets of output columns, so the resulting table would be missing one column in any case.
OK, now that the target table is ready, it’s time to run XESmartTarget:
"%ProgramFiles%\XESmartTarget\xesmarttarget.exe" --File c:\temp\Recipe_07_Table_Audit.json --GlobalVariables ServerName=(local)\SQLEXPRESSThe console window shows that the two Responses are writing data independently:
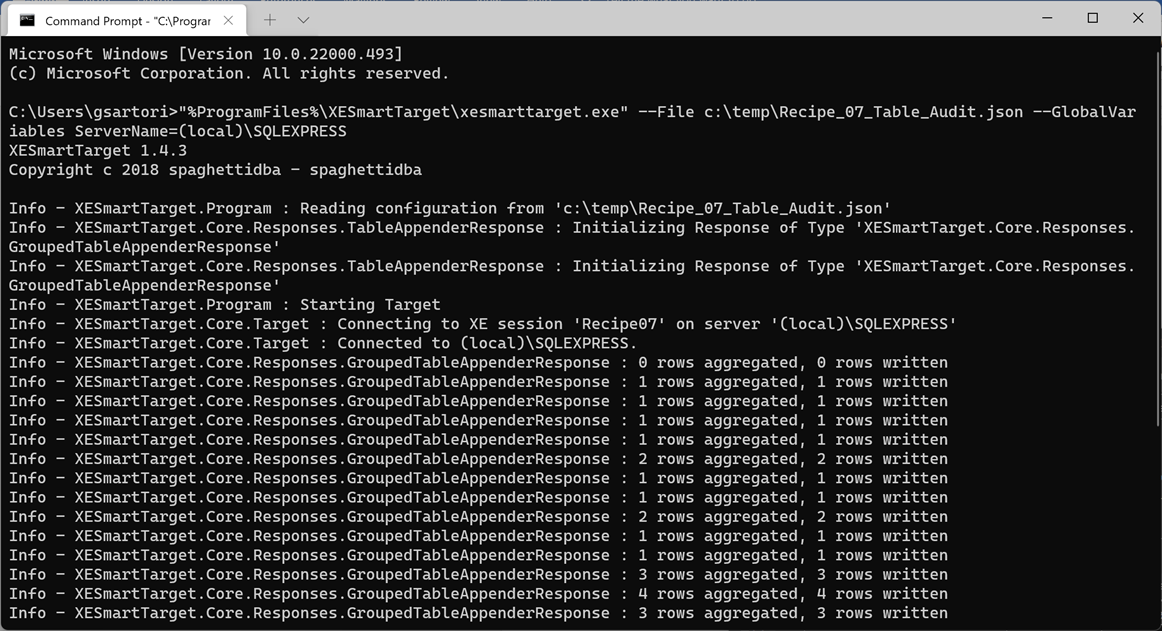
If you query the target table, you will see that some tables appear there. Some will have a last_read date, some will have a last_write date and some will have both dates.

If you keep the application running for a meaningful amount of time, you will see all the tables appear in the target table, except for the ones that are not used. That’s pretty cool!
In case you’re wondering, this works also if you have Read Committed Snapshot Isolation activated on your database.
Recap
GroupedTableAppenderResponse can help you accomplish many tasks, including finding unused tables.
In the next recipe you will see use the GroupedTableAppenderResponse to analyze a workload and use the “collection_time” automatic column to create series of data based on the time of the event. Keep watching the XESmartTarget tag!
