Monthly Archives: March 2019
Generating a Jupyter Notebook for Glenn Berry’s Diagnostic Queries with PowerShell
The March release of Azure Data Studio now supports Jupyter Notebooks with SQL kernels. This is a very interesting feature that opens new possibilities, especially for presentations and for troubleshooting scenarios.
For presentations, it is fairly obvious what the use case is: you can prepare notebooks to show in your presentations, with code and results combined in a convenient way. It helps when you have to establish a workflow in your demos that the attendees can repeat at home when they download the demos for your presentation.
For troubleshooting scenarios, the interesting feature is the ability to include results inside a Notebook file, so that you can create an empty Notebook, send it to your client and make them run the queries and send it back to you with the results populated. For this particular usage scenario, the first thing that came to my mind is running the diagnostic queries by Glenn Berry in a Notebook.
Obviously, I don’t want to create such a Notebook manually by adding all the code cells one by one. Fortunately, PowerShell is my friend and can do the heavy lifting for me.
Unsurprisingly, dbatools comes to the rescue: André Kamman added a cmdlet that downloads, parses and executes Glenn Berry’s diagnostic queries and added the cmdlet to dbatools. The part that can help me is not a public function available to the user, but I can still go to GitHub and download the internal function Invoke-DbaDiagnosticQueryScriptParser for my needs.
The function returns a list of queries that I can use to generate the Jupyter Notebook:
This file contains hidden or bidirectional Unicode text that may be interpreted or compiled differently than what appears below. To review, open the file in an editor that reveals hidden Unicode characters.
Learn more about bidirectional Unicode characters
| # | |
| # Purpose: take the diagnostic queries from Glenn Berry | |
| # and generate a Jupyter Notebook to run in Azure Data Studio | |
| # | |
| # Example usage: | |
| # create-diagnostic-notebook.ps1 -diagnosticScriptPath "C:\Program Files\WindowsPowerShell\Modules\dbatools\0.9.777\bin\diagnosticquery\SQLServerDiagnosticQueries_2019_201901.sql" -notebookOutputPath "diagnostic-notebook.ipynb" | |
| # | |
| [CmdletBinding()] | |
| Param( | |
| [parameter(Mandatory)] | |
| [System.IO.FileInfo]$diagnosticScriptPath, | |
| [System.IO.FileInfo]$notebookOutputPath | |
| ) | |
| # | |
| # Function taken from dbatools https://github.com/sqlcollaborative/dbatools/blob/development/internal/functions/Invoke-DbaDiagnosticQueryScriptParser.ps1 | |
| # Parses the diagnostic script and breaks it into individual queries, | |
| # with text and description | |
| # | |
| function Invoke-DbaDiagnosticQueryScriptParser { | |
| [CmdletBinding(DefaultParameterSetName = "Default")] | |
| Param( | |
| [parameter(Mandatory)] | |
| [ValidateScript( {Test-Path $_})] | |
| [System.IO.FileInfo]$filename, | |
| [Switch]$ExcludeQueryTextColumn, | |
| [Switch]$ExcludePlanColumn, | |
| [Switch]$NoColumnParsing | |
| ) | |
| $out = "Parsing file {0}" -f $filename | |
| write-verbose -Message $out | |
| $ParsedScript = @() | |
| [string]$scriptpart = "" | |
| $fullscript = Get-Content -Path $filename | |
| $start = $false | |
| $querynr = 0 | |
| $DBSpecific = $false | |
| if ($ExcludeQueryTextColumn) {$QueryTextColumn = ""} else {$QueryTextColumn = ", t.[text] AS [Complete Query Text]"} | |
| if ($ExcludePlanColumn) {$PlanTextColumn = ""} else {$PlanTextColumn = ", qp.query_plan AS [Query Plan]"} | |
| foreach ($line in $fullscript) { | |
| if ($start -eq $false) { | |
| if (($line -match "You have the correct major version of SQL Server for this diagnostic information script") -or ($line.StartsWith("– Server level queries ***"))) { | |
| $start = $true | |
| } | |
| continue | |
| } | |
| if ($line.StartsWith("– Database specific queries ***") -or ($line.StartsWith("– Switch to user database **"))) { | |
| $DBSpecific = $true | |
| } | |
| if (!$NoColumnParsing) { | |
| if (($line -match "– uncomment out these columns if not copying results to Excel") -or ($line -match "– comment out this column if copying results to Excel")) { | |
| $line = $QueryTextColumn + $PlanTextColumn | |
| } | |
| } | |
| if ($line -match "-{2,}\s{1,}(.*) \(Query (\d*)\) \((\D*)\)") { | |
| $prev_querydescription = $Matches[1] | |
| $prev_querynr = $Matches[2] | |
| $prev_queryname = $Matches[3] | |
| if ($querynr -gt 0) { | |
| $properties = @{QueryNr = $querynr; QueryName = $queryname; DBSpecific = $DBSpecific; Description = $queryDescription; Text = $scriptpart} | |
| $newscript = New-Object -TypeName PSObject -Property $properties | |
| $ParsedScript += $newscript | |
| $scriptpart = "" | |
| } | |
| $querydescription = $prev_querydescription | |
| $querynr = $prev_querynr | |
| $queryname = $prev_queryname | |
| } else { | |
| if (!$line.startswith("–") -and ($line.trim() -ne "") -and ($null -ne $line) -and ($line -ne "\n")) { | |
| $scriptpart += $line + "`n" | |
| } | |
| } | |
| } | |
| $properties = @{QueryNr = $querynr; QueryName = $queryname; DBSpecific = $DBSpecific; Description = $queryDescription; Text = $scriptpart} | |
| $newscript = New-Object -TypeName PSObject -Property $properties | |
| $ParsedScript += $newscript | |
| $ParsedScript | |
| } | |
| $cells = @() | |
| Invoke-DbaDiagnosticQueryScriptParser $diagnosticScriptPath | | |
| Where-Object { -not $_.DBSpecific } | | |
| ForEach-Object { | |
| $cells += [pscustomobject]@{cell_type = "markdown"; source = "## $($_.QueryName)`n`n$($_.Description)" } | |
| $cells += [pscustomobject]@{cell_type = "code"; source = $_.Text } | |
| } | |
| $preamble = @" | |
| { | |
| "metadata": { | |
| "kernelspec": { | |
| "name": "SQL", | |
| "display_name": "SQL", | |
| "language": "sql" | |
| }, | |
| "language_info": { | |
| "name": "sql", | |
| "version": "" | |
| } | |
| }, | |
| "nbformat_minor": 2, | |
| "nbformat": 4, | |
| "cells": | |
| "@ | |
| $preamble | Out-File $notebookOutputPath | |
| $cells | ConvertTo-Json | Out-File -FilePath $notebookOutputPath -Append | |
| "}}" | Out-File -FilePath $notebookOutputPath -Append |
In order to use the script, you need to provide the path to the file that contains the diagnostic queries and the path where the new Jupyter Notebook should be generated. Dbatools includes the latest version of the diagnostic scripts already, so you just need to choose which flavor you want to use. You will find all available scripts in the module directory of dbatools:
$dbatoolsPath = Split-Path -parent (Get-Module -ListAvailable dbatools).path
$dbatoolsPath
Get-ChildItem "$dbatoolsPath\bin\diagnosticquery" | Select-Object Name
The script above produces this output:
C:\Program Files\WindowsPowerShell\Modules\dbatools\0.9.777

Name
----
SQLServerDiagnosticQueries_2005_201901.sql
SQLServerDiagnosticQueries_2008R2_201901.sql
SQLServerDiagnosticQueries_2008_201901.sql
SQLServerDiagnosticQueries_2012_201901.sql
SQLServerDiagnosticQueries_2014_201901.sql
SQLServerDiagnosticQueries_2016SP2_201901.sql
SQLServerDiagnosticQueries_2016_201901.sql
SQLServerDiagnosticQueries_2017_201901.sql
SQLServerDiagnosticQueries_2019_201901.sql
SQLServerDiagnosticQueries_AzureSQLDatabase_201901.sql
Once you decide which file to use, you can pass it to the script:
create-diagnostic-notebook.ps1 `
    -diagnosticScriptPath "C:\Program Files\WindowsPowerShell\Modules\dbatools\0.9.777\bin\diagnosticquery\SQLServerDiagnosticQueries_2019_201901.sql" `
    -notebookOutputPath "diagnostic-notebook.ipynb"
What you obtain is a Jupyter Notebook that you can open in Azure Data Studio:
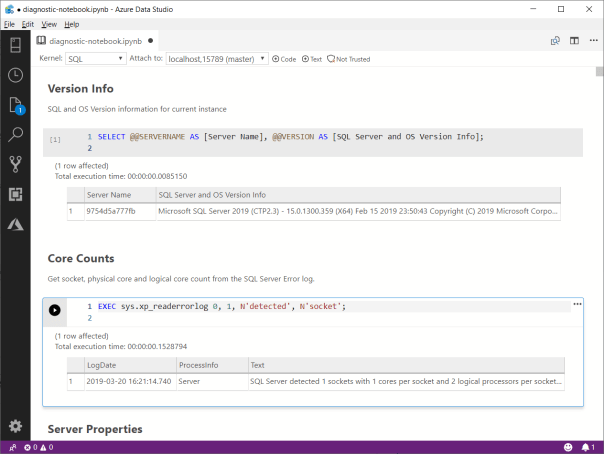
This is nice way to incorporate the code and results in a single file, that you can review offline later. This also allows you to send the empty notebook to a remote client, ask to run one or more queries and send back the notebook including the results for you to review.
Happy Notebooking!
Capturing a Workload with WorkloadTools
Last week I showed you how to use WorkloadTools to analyze a workload. As you have seen, using SqlWorkload to extract performance data from your workload is extremely easy and it just takes a few keystrokes in your favorite text editor to craft the perfect .json configuration file.
Today I’m going to show you how to capture a workload and save it to a file. If you’ve ever tried to perform this task with any other traditional benchmarking tool, like RML Utilities or Distributed Replay, your palms are probably sweaty already, but fear not: no complicated traces to set up, no hypertrophic scripts to create extended events captures. WorkloadTools makes it as easy as it can get.
Saving a workload to a file might look superfluous when you think that WorkloadTools has the ability to perform replays in real-time (I’ll discuss this feature in a future post), but there are situations when you want to replay the same exact workload multiple times, maybe changing something in the target database between each benchmark to see precisely what performance looks like under different conditions.
Another scenario where saving the workload to a file comes handy is when the source and destination servers are on different isolated networks and cannot communicate directly: in this case, you will save the workload to a file, copy it to the network where the target server resides and perform the replay there.
Choosing a file format
Before I show you how to do it, please allow me to explain what type of file we are going to write to and why I decided to use this format. If you’re not interested in this kind of geeky stuff, you can skip to the next section, no offense taken.
As already mentioned in my previous blog post, SqlWorkload uses a Listener object that relies on the underlying technology to capture the execution events that form the workload, so we have specialized Listeners for SqlTrace and for Extended Events. However, the Listener reads the events from the underlying source and then discards the source immediately.
When the workload is captured with an Extended Events session and the events are processed with the streaming API for Extended Events, it is pretty obvious how this works and why there is no .xel file at the end of the capture: the events are never written to a file and they are processed on the fly. In the same way, when the workload is captured with SqlTrace, SqlWorkload makes sure to keep the trace files on the server’s file system as shortly as possible, so it reads the events from the tail of the active rollover file and forwards them to the Consumers immediately: again, at the end of the capture, there will be no trace file available.
Long story short: using one of the traditional capture formats would require to instruct SQL Server to leave the files on the file system, which is not what we want and often something we cannot do.
Moreover, choosing one of the traditional formats (SqlTrace or Extended Events) would be problematic: Extended Events only works with SQLServer 2012 and newer and SqlTrace can only be read and written with an old 32 bit COM API.
What I decided to use as the intermediate format for SqlWorkload is a SqLite database, that contains a handful of tables that persist all the queries captured by the Listener. Yeah, sure: when you’re a database professional it feels very natural to use a database to store information (if all you have is a hammer, everything looks like a nail), but I can assure you that it is far from an unreasonable decision. Using a SqLite database allows you to inspect, modify and filter the workload data with extreme ease, using industry standard tools.
But enough talking about my decisional process: let’s go straight to the meat of this post.
Capturing a Workload
As you probably have guessed, capturing a workload is a matter of preparing a .json file with all the parameters and feeding it to SqlWorkload.
All you need is a Listener that captures the workload using SqlTrace or Extended Events and then a Consumer that takes care of writing to a SqLite file.
The .json file will be similar to this:
{
    "Controller": {

        "Listener":
        {
            // I'm using Extended Events here, but it could
            // be any type of listener
            "__type": "ExtendedEventsWorkloadListener",
            "ConnectionInfo":
            {
                "ServerName": "(local)"
            },
            "DatabaseFilter": "MyDatabase"
        },

        "Consumers":
        [
            {
                // The File Writer consumer takes care
                // of saving the workload to a file
                "__type": "WorkloadFileWriterConsumer",
                "OutputFile": "C:\\temp\\SqlWorkload.sqlite"
            }
        ]
    }
}
Once the configuration file is ready, you just need to pass its path as a command line argument to SqlWorkload and the Listener will start to forward all the events to the File Writer Consumer. You will see an output similar to this:

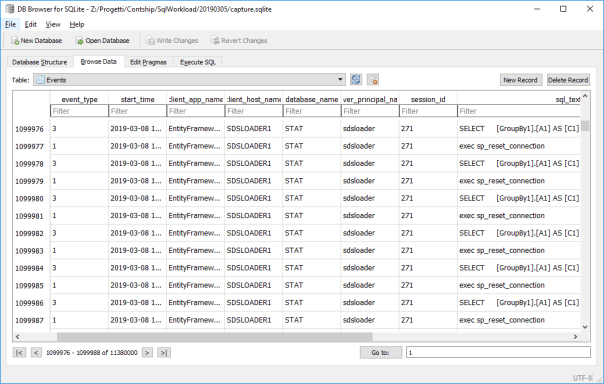
When you are done capturing the workload, you can stop SqlWorkload by pressing CTRL+C and you will be left with a SqLite file containing all your workload. You can actually open that file with a SqLite client of your choice and see what it contains. SqLite Browser is one of the possibilities, but there are countless options in Windows, Linux and Mac.
Converting an existing SqlTrace or Extended Events file
You are probably wondering what to do if you already have a set of SqlTrace or Extended Events files that describe your workload perfectly: you probably don’t want to capture the workload again just for the sake of using it with SqlWorkload. Don’t worry: WorkloadTools also contains a command line tool to convert .trc and .xel files to the SqLite format understood by SqlWorkload.
All you have to do is run ConvertWorkload and pass the path to the source file and the path to the output file.
Conclusions
Again, it couldn’t get easier than that: SqlWorkload provides a Consumer to capture your workload to a file for later use, be it a replay or analysis. All you have to do is fill some info in a .json file and SqlWorkload takes care of the rest for you.
In the next post we will see how to replay a workload using WorkloadTools and we will see how one of the possible sources for the replay can be in fact one of these SqLite files produced by the File Writer Consumer.
Stay tuned!
