Workload analysis with WorkloadTools
Last week I introduced WorkloadTools and promised additional posts to describe what it can do in more detail. So, here we go: in this post I will show you how to use WorkloadTools to capture a workload and analyze it, in order to find things like the most resource-intensive queries or discover how the application behaves over time.
Capturing the workload
First of all, you need to capture the workload using SqlWorkload. As stated in the documentation, you need to provide a .json file that contains all the parameters needed to configure the Listener and the Consumers.
Configuring the Listener
You have two types of listeners to choose from in this case, and the choice will be determined mainly by the version of SQLServer that you’re working on: with older versions (up to SQLServer 2008 R2), you will have no choice but to use a SqlTraceWorkloadListener, because Extended Events do not provide the required events (sql_batch_completed in particular).
With newer versions (from SQLServer 2012 onwards), you can use an ExtendedEventsWorkloadListener.
Regardless of the type of Listener that you choose, there is not much information that you need to provide: the name of the server to connect to and the credentials are usually more than enough. The following json fragment shows a sample Listener configuration:
"Listener":
{
    // This line decides which type of Listener to use
    // Put the name of the class of your choice in this param
    "__type": "ExtendedEventsWorkloadListener",
    "ConnectionInfo":
    {
        // Server name and credentials
        "ServerName": "SQLDEMO\\SQL2014",
        "DatabaseName": "master",
        // Omit UserName and Password to use
        // Windows Authentication
        "UserName": "sa",
        "Password": "P4$$w0rd!"
    },
    // If you want to reduce the workload,
    // put some filters here
    "DatabaseFilter": "DS3"
}
Some things to note:
- The .json file accepts comments, even if the JSON standard does not allow comments. The file gets minified before reading, so all comments get stripped away. Comments are useful for describing what the file does and why it configures things in that particular way.
- Each Listener type accepts a different set of parameters. See the documentation for more details. Not all parameters are mandatory (optional parameters and their default value are described in square brackets).
- You do not need to configure, start and stop a particular trace or Extended Events session: SqlWorkload takes care of everything for you. If you really wanted to, you could override the default trace/session script (but most of the times you don’t want to do that)
- Filtering the source events is a good idea in several situations: it helps breaking down complex workloads by database, application, login or host.
Regardless of the type of Listener in use, the workload does not need to get completely written to a SqlTrace or Extended Events file before it can be used by the Listener, but the events are read from the Listener source incrementally, using different techniques, that depend on the Listener type.
For instance, for an ExtendedEventsWorkloadListener, the Listener uses the XE streaming API to read the events without having to save them to a file target first. For a SqlTraceWorkloadListener, the events need to go to a trace file first, but SqlWorkload makes sure to use small rollover files and always reads the tail of the last available file. The same happens with ExtendedEventsWorkloadListener when the FileTargetPath property is specified (this is mandatory for Azure SqlDatabase and must point to a blog storage URL).
Configuring the Consumers
All the events captured by the Listener are forwarded to all the Consumers registered on the Listener itself. You could have multiple Consumers for the same Listener, but in this example one Consumer is sufficient.
Your goal is to capture the workload on the source server and extract some information about the shape of the workload itself, looking for resource-intensive queries, long-running queries or queries that have a high number of executions. The correct Consumer type for this is the AnalysisConsumer.
This Consumer type can be configured in many aspects, but in its simplest form, it just needs to receive the name of the server, database and schema where the workload analysis tables will be created and populated. The schema name is important, because you may want to compare different benchmarks and the easiest way to do this is to save each benchmark to a different schema.
// Consumers are contained in a list
"Consumers":
[
    {
        // Choose the appropriate type of Consumer
        "__type": "AnalysisConsumer",
        // Fill in connection information
        "ConnectionInfo":
        {
            "ServerName": "SQLDEMO\\SQL2016",
            "DatabaseName": "SqlWorkload01",
            "SchemaName": "capture",
            "UserName": "sa",
            "Password": "P4$$w0rd!"
        },
        // This parameter controls how often the consumer
        // aggregates performance data and writes to the
        // analysis database
        "UploadIntervalSeconds": 60
    }
]
UploadIntervalSeconds is another important parameter, because it controls how often the workload analysis data is written to the destination database. AnalysisConsumer uses this parameter to time the creation of “intervals”: inside each interval, the performance data is aggregated by query, application, database, host name and login name.
The queries also get normalized during the analysis process: each constant or literal inside the query text gets replaced by a placeholder, which allows to aggregate together queries that differ only by the constant values. During the normalization process, SqlWorkload also calculates a 64 bit query hash, that can be used to retrieve the normalized query text and a sample query text captured before the normalization occurs.
Please note that, at the time of writing, the destination database does not get created automatically and needs to be created upfront. I am planning to remove this limitation, so keep an eye on this issue.
Putting it all together and starting SqlWorkload
Now that Listener and Consumer are configured, you just need to put it all together in a single .json file and pass it to SqlWorkload.
Here is the complete sqlworkload.json:
{
    "Controller": {

        "Listener":
        {
            "__type": "ExtendedEventsWorkloadListener",
            "ConnectionInfo":
            {
                "ServerName": "SQLDEMO\\SQL2014",
                "DatabaseName": "master",
                "UserName": "sa",
                "Password": "P4$$w0rd!"
            },
            "DatabaseFilter": "DS3"
        },

        "Consumers":
        [
            {
                "__type": "AnalysisConsumer",
                "ConnectionInfo":
                {
                    "ServerName": "SQLDEMO\\SQL2016",
                    "DatabaseName": "SqlWorkload01",
                    "SchemaName": "capture",
                    "UserName": "sa",
                    "Password": "P4$$w0rd!"
                },
                "UploadIntervalSeconds": 60
            }
        ]
    }
}
Now that file is ready, save it (e.g. analyze.json) and use it to run SqlWorkload:
"%programfiles%\workloadtools\sqlworkload.exe" --File "%cd%\analyze.json"
If everything is ok, SqlWorkload will start to print messages to the standard output of your cmd window:
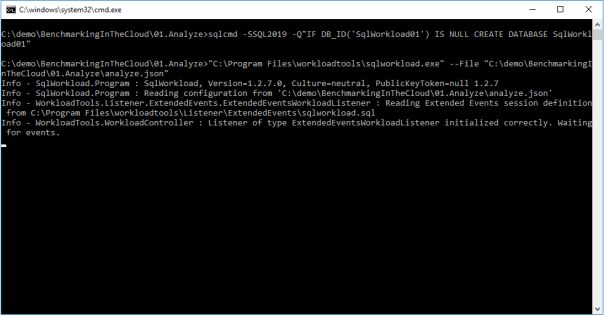
SqlWorkload also writes to a log file (SqlWorkload.log), that you will find in the working directory. You can control the log level and other logging parameters by editing NLog.config in the installation folder.
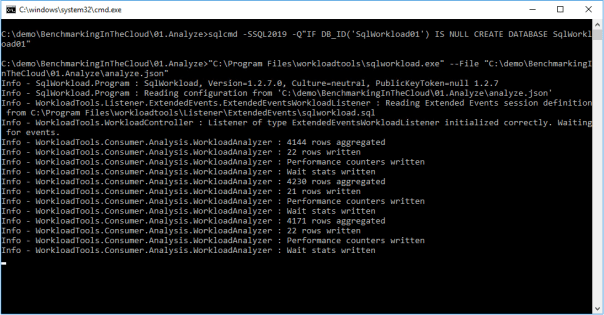
Every “UploadIntervalSeconds”, SqlWorkload will create a new interval, aggregate the performance data and upload everything to the analysis databases. You will see a message similar to this when the upload occurs:
When you think that the capture has lasted long enough, you can stop SqlWorkload by pressing CTRL+C. If you close the command window, it will not clean up the objects created for the capture, like Extended Events sessions or SqlTrace captures.
Another option is to specify a value for the optional parameter TimeoutMinutes on the Listener configuration: when the timeout expires, the capture will stop automatically.
Visualizing performance data with WorkloadViewer
Now that the analysis database contains the performance data, you can use WorkloadViewer to visualize it and draw your conclusions.
WorkloadViewer is a GUI tool that reads performance data from the analysis database and gives a graphical representation using charts and grids. It accepts a number of command line arguments that allow to automate its behavior, but it can be also opened without specifying any arguments: in this case, WorkloadViewer will present a form to fill the missing information.
WorkloadViewer can be used to visualize information about a single benchmark (analysis mode) or two benchmarks (comparison mode). In this case, you just need to work with a single benchmark, so it is enough to enter the connection info on the left, including the schema name where the tables are. When using Windows Authentication, you can leave UserName and Password blank.

WorkloadViewer shows data in three tabs:
- Workload
- Queries
- Query Details
The “Workload” tab shows three charts for total CPU, total duration and batches per second for each interval. This is useful to see how the workload evolves over time and identify any correlation between the three metrics.
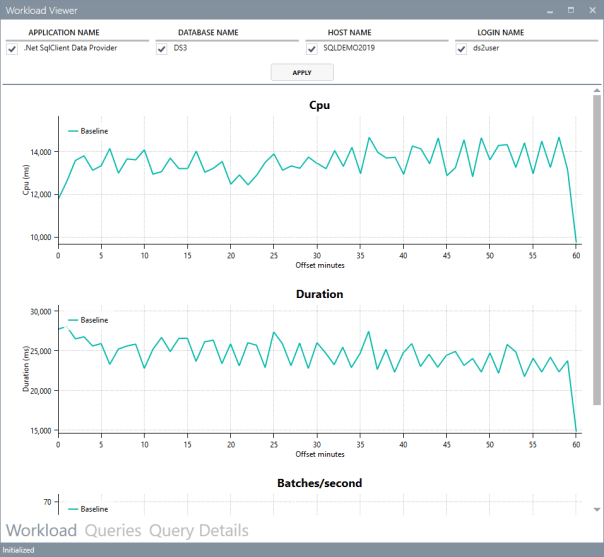
The charts support panning (click and drag with the right mouse button) and zooming (mouse wheel) as well as zooming to a particular area (click and drag with the middle mouse button). To reset zoom and pan, double click with the middle mouse button.
The “Queries” tab contains a grid that displays important metrics about the individual queries: avg/sum CPU, avg/sum Duration, avg/sum reads, total number of executions. These metrics are calculated over the entire workload.
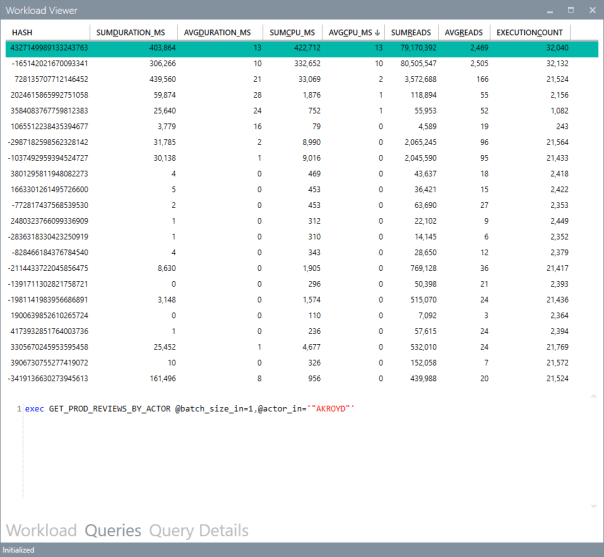
You can sort by a particular column by clicking the header: this allows you to rank queries by one of the metrics and identify immediately the top queries by that metric.
Clicking on one of the rows displays the query text on the bottom panel. Double clicking one of the rows takes you to the “Query Details” tab.

This tab displays information about the individual query: it contains the query text and the overall performance metrics, broken down by application name, database name, host name and login name.
The chart displays the average CPU usage over time.
WorkloadViewer is still heavily being worked on and it is not showing all the data available in the analysis database, but I hope to include more information in the future. If you feel adventurous enough, you can point PowerBI to the analysis database and produce a dashboard designed on your specific needs.
Conclusions
As you can see, WorkloadTools can be a valuable help when you need to analyze a workload. SqlWorkload allows you to capture all the data that you need with extreme ease, without having to configure anything other than basic connection information.
WorkloadViewer allows you to visualize the data in a convenient way and can give you an immediate overview of your workload, ranking queries by the most important performance metrics.
But this is only one of the many tasks that you can accomplish with WorkloadTools: in the weeks to come I will continue to write on this topic and I will show you how to unleash the full potential of WorkloadTools.
Stay tuned!
Posted on February 26, 2019, in SQL Server and tagged Open Source, Performance Tuning, SQL Server, WorkloadTools. Bookmark the permalink. 41 Comments.

Hi Gianluca,
First of all, thanks for making this available to SQL Server community.
Like like a very promising tool!
I’ve started evaluating it and run into a problem when trying to visualize data I capture with SQLWorkload. I’ve entered Baseline information only (Server, Database and schema) using Windows Authentication and received following error:
‘Unable to load data: Attempted to divide by zero’
SQL Profiler captured following two queries when attempting to analyze captured workload with WorkloadViewer:
SELECT * FROM capture.NormalizedQueries
WITH baseData AS (
SELECT
DATEDIFF(minute, Base.end_time, bIn.end_time) AS offset_minutes,
bWD.sql_hash,
bWD.avg_cpu_ms,
bWD.min_cpu_ms, …..
Any thoughts regarding this issue?
Thanks,
Igor
I’ll look into that ASAP. I’m just a lone developer and the tool is under development, so errors are expected, unfortunately. Thanks for reporting it!
I think I found the problem. I will release a new version shortly. Thank you for reporting the issue.
Thank you!
I see you’ve checked in the fix. I wasn’t sure if you also updated msi file. Could you please confirm?
Sorry, I did not release the fix because I also have other pending changes that need to be verified thoroughly before I release them. If you want it, I can release a pre-release with the changes, but I can’t guarantee everything in there works.
Thanks for prompt reply. No worries. I don’t want to rush you. I will be waiting for a scheduled release.
Awesome. I’ll ping you here when I have the new release ready.
New version 1.2.9 is out, download from here. https://github.com/spaghettidba/WorkloadTools/releases/latest Should be ok now. Let me know if it works for you.
Downloaded and installed latest version. I was able to open WorkloadViewer.exe and connect the database where workload was captured. I can see reports loaded in the background. However, main Login dialog remains open. I tried clicking Ok, but Login (Baseline and Benchmark) dialog keeps reappearing. Clicking Cancel closes application.
I’ve also noticed some background errors when running SQLWorkload:
Warn – WorkloadTools.Consumer.Analysis.WorkloadAnalyzer : Violation of PRIMARY KEY constraint ‘PK__Interval__6ED7FE58634F16F1’. Cannot insert duplicate key in object ‘capture.Intervals’. The duplicate key value is (605617685).
I guess this is something we can ignore for now, right?
Thanks,
Igor
Violation of primary key suggests that you’re either reusing the same database for multiple captures or using the same schema name for both baseline and benchmark.
The dialog not closing is something that I’m aware of but was unable to fix. I’ll give it another look
Hmm. I am explicitly pointing to brand new database every time I run SQLWorkload. That’s not a big issue though.
I am able to run analysis against table we are capturing data into (NormalizedQueries ,etc.). I am simply aggregating data and assigning percentages each category (e.g. Reads, Writes). In other words, simply capturing/normalizing data is proving to be already extremely useful!
In your experience, on a busy OLTP system, what would be the most efficient/lightweight way of capturing workload?
My assumption is that capturing and loading data into separate SQL Server within the same network using ExtendedEventsWorkloadListener would be the preferred way.
In the past, I’ve been trying to capture data into file (either using server side trace or Extended Events). I usually tried to avoid capturing into database directly.
What are your thoughts?
If you don’t mind sending your json file I can have a look. Send it to spaghettidba@sqlconsulting.it
Regarding how to capture on a busy server, it depends on how busy it is. On a server with around 4000 transactions per second I could capture using the extended events listener without any issues. On a much busier server I had to break down filtering by application or database.
A good idea is to use a separate machine to run sqlworkload in order to avoid using too much RAM on the database server.
This should get you started. In case you need more help, just shoot me an email.
Hi,
I am trying to use your solution to do the following:
1) Record from database A into *.sqlite file
2) Use *.sqlite file as source and write analyse into Database X
3) Playback from *.sqllite file on database B and write analyse into Database Y
4) Compare database X and Y with workloadviewer.
The issue I have is that the result in X and Y seems to be identical. I would not expect that. Something that I am not understanding or doing wrong?
First capture file:
{
“Controller”: {
“Listener”:
{
“__type”: “ExtendedEventsWorkloadListener”,
“ConnectionInfo”:
{
“ServerName”: “ServerA\\instanceA”
},
“DatabaseFilter”: “A”
},
“Consumers”:
[
{
“__type”: “WorkloadFileWriterConsumer”,
“OutputFile”: “c:\\temp\\SqlWorkload.sqlite”
}
]
}
}
this gives me around 1200 Events based on starting my application and doing the most important tasks.
I then want to write this result to the Analysis database
{
“Controller”: {
“Listener”:
{
“__type”: “FileWorkloadListener”,
“Source”: “c:\\temp\\SqlWorkload.sqlite”,
“SyncronizationMode”: “false”
},
“Consumers”:
[
{
“__type”: “AnalysisConsumer”,
“ConnectionInfo”:
{
“ServerName”: “ServerB\\InstanceB”,
“DatabaseName”: “X”,
“SchemaName”: “dbo”
},
“UploadIntervalSeconds”:60
}
]
}
}
I then want to replay the same workload on database B:
{
“Controller”: {
“Listener”:
{
“__type”: “FileWorkloadListener”,
“Source”: “c:\\temp\\SqlWorkload.sqlite”,
“SyncronizationMode”: “true”
},
“Consumers”:
[
{
“__type”: “ReplayConsumer”,
“ConnectionInfo”:
{
“ServerName”: “MyServerB\\MyInstanceB”,
“DatabaseName”: “B”,
“SchemaName”: “dbo”
}
},
{
“__type”: “AnalysisConsumer”,
“ConnectionInfo”:
{
“ServerName”: “MyServerB\\MyInstanceB”,
“DatabaseName”: “Y”,
“SchemaName”: “dbo”
},
“UploadIntervalSeconds”: 60
}
]
}
}
But the results I receive when comparing both results does not seem to be correct?
the DIFFSUM_ columns is all 0.
The problem is the way you perform the analysis. The second JSON uses the sqlite database as the source for the workload, then sends the events to the analysis consumer. All good.
The third JSON uses again the same sqlite database as the source and sends the events to two consumers: a replay consumer that replays the events on server B and again an Analysis consumer that receives the same exact events in the sqlite file, so the two analysis data sources of course contain the same exact data.
If you need the analysis from the server B, you need to create one more JSON file and use it to capture the activity from server B (extended events listener) and write it to analysis consumer. This obviously needs to run while the replay is also running, so you will have two instances of sqlworkload.exe running at the same time.
I hope this clears it up for you.
Good luck!
Nice. That seems to be working better. Thank you for your quick reply. I was also trying to fire up your powerbi-reports, but after I changed the source-it gave error-codes. What do I need to do to be able to use the reports?
The powerbi reports have been largely updated. Try downloading the latest version from the head: https://github.com/spaghettidba/WorkloadTools/tree/master/Reports
Hi
I think this is a daft question, but where can I find sqlworkload.exe? The command line that is used in this example is:
“%programfiles%\workloadtools\sqlworkload.exe” –File “%cd%\analyze.json”
I’ve searched throuh https://github.com/spaghettidba/WorkloadTools , but it doesn’t appear to be there.
Thanks for your help!
Hi Andrew,
The software needs to installed first. You can download the setup kit from the releases page in GitHub. Here’s a direct link to the latest release.
Download and install the setup kit and you will find sqlworkload.exe in %programfiles%\workloadtools
Cheers
Gianluca
Argh I feel like such a plonker. It says it right under the files in github (in the readme part.) Must have been a long day today!
Many thanks for your help!
Andrew
Hi,
I’m trying to gather a workload from my production EC2 SQL Server 2017 instance and replay that workload on a Test SQL Server 2017 instance. I ran the capture from prod capturing the data to a sqlite db. This is the .json I ran in prod for the 1:00 PM hour:
{
“Controller”: {
“Listener”:
{
“__type”: “ExtendedEventsWorkloadListener”,
“ConnectionInfo”:
{
“ServerName”: “psql01.internal.talentreef.com”,
“UserName”: “SqlWorkLoadUserName”,
“Password”: “pwd”
},
“DatabaseFilter”: “dbname”
},
“Consumers”:
[
{
“__type”: “WorkloadFileWriterConsumer”,
“OutputFile”: “G:\\PerformanceTest\\SqlWorkload12-1-100.sqlite”
}
]
}
}
I took that .sqlite file to my Test instance. I want to replay this with this .json:
“Controller”: {
“Listener”:
{
“__type”: “FileWorkloadListener”,
“Source”: “G:\\PerformanceTest\\SqlWorkload12-1-100.sqlite”,
// in this case you want to simulate the original query rate
“SynchronizationMode”: “true”
},
“Consumers”:
[
{
“__type”: “ReplayConsumer”,
“ConnectionInfo”:
{
“ServerName”: “TestSQLServer”,
“DatabaseName”: “dbname”,
“UserName”: “SqlWorkLoadUserName”,
“Password”: “pwd”
},
{
“__type”: “AnalysisConsumer”,
“ConnectionInfo”:
{
“ServerName”: “TestSQLServer”,
“DatabaseName”: “SqlWorkLoad_dbname”,
“SchemaName”: “replay1PM”
},
“UploadIntervalSeconds”: 60
}
]
}
This is where your documentation is confusing. What’s the next step?
Hi Miles,
I suppose that at this point you want to compare the two workloads. You can do that by analyzing them to an analysis database. The replay that you set up with your second json file writes the analysis data OF THE SOURCE WORKLOAD to the database.
During the replay you must have a second instance of SqlWorkload that catpures the replay itself and writes analysis data to the database. You can find information on how that works in this video: https://www.youtube.com/watch?v=yqg2Y00IWx0
Thank you for replying to my email.
I did have another question for you.
I restored the backups from the SOURCE (PROD) Instance onto the TARGET (TEST) Instance. These backups are from the time period of when the capture was run. When running the SqlWorkLoad tools Replay or Analysis consumer on my TARGET Instance , will the SqlWorkLoad tools Replay or Analysis consumer make any changes to the Target Databases I am analyzing? Will I need to restore the original SOURCE databases on the TARGET Instance after the Replay or Analysis Consumers run? I am asking because I plan to do only 1 hour captures on PROD at a time. For example, I will run the Replay and Analysis for 7AM to 8AM on the TARGET Instance. When the workload completes running on the TARGET Instance, *will I need to do a new restore of the SOURCE Instance databases on the TARGET Instance?*
Thanks for your help.
Miles
Yes, the replay will change the data in your target database, because it will replay all the events captured at the source. The analysis consumer will not make any changes to the target database, unless you use it for storing the analysis itself, which is not recommended.
Hope this helps!
Thanks again for your response.
It looks like if I the want to run a replay for a different capture time range, I will need to restore the target database(s) prior to running that replay and analysis to get clean data.
Still not getting this right.
I have a captured workload from Prod using this .json: { “Controller”: {
“Listener”: { “__type”: “ExtendedEventsWorkloadListener”, “ConnectionInfo”: { “ServerName”: “SourceServer, “UserName”: “UserName”, “Password”: “Password” } },
“Consumers”: [ { “__type”: “WorkloadFileWriterConsumer”, “OutputFile”: “G:\\PerformanceTest\\SqlWorkload.sqlite” } ] } }
Then I take that SqlWorkload.sqlite file to my Target Server and run a 1st sqlworkload.exe this Part1.json simultaneously with a 2nd sqlworkload.exe Part2.json file:
/////Part1 json file { “Controller”: {
“Listener”: { “__type”: “FileWorkloadListener”, “Source”: “G:\\PerformanceTest\\SqlWorkload.sqlite”, “SynchronizationMode”: “true” },
“Consumers”: [ { “__type”: “ReplayConsumer”, “ConnectionInfo”: { “ServerName”: ” TargetServerName “, “UserName”: “UserName”, “Password”: “Password” },
“__type”: “AnalysisConsumer”, “ConnectionInfo”: { “ServerName”: “TargetServerName”, “DatabaseName”: “BenchmarkDatabaseName”, “SchemaName”: “SchemaName” }, “UploadIntervalSeconds”: 60 }
] } } ////Part2 json file { “Controller”: {
“Listener”: { “__type”: “ExtendedEventsWorkloadListener”, “ConnectionInfo”: { “ServerName”: “TargetServer”, “UserName”: “UserName”, “Password”: “Password” } },
“Consumers”: [ { “__type”: “AnalysisConsumer”, “ConnectionInfo”: { “ServerName”: “TargetServer”, “DatabaseName”: “BenchmrkDatabaseName”, “UserName”: “UserName”, “Password”: “Password”, “SchemaName”: “SchemaName” }, “UploadIntervalSeconds”: 60 } ] } }
I ran them simultaneously on the Target Server to compare the workload analysis. I am not getting any comparison. The Power-BI results show the data for the Benchmark, but the data for the Baseline does not show. When I run a Comparison of the Baseline and Benchmark data I get usable information.
I have attached 3 screenshots of the Power-BI results. A is this Comparison,B is the Baseline Analysis data and C is the Benchmark Analysis data.
I still do not believe I am doing this correctly.
Thanks for your prompt replies.
Miles
Hi. Is there a way to save the WorkloadViewer output?
Hi Miles, sorry for the delay. You can use the provided PowerBI dashboard to save a snapshot of the analysis as a file. You can find the dashboard in the workloadtools path, under the reports folder. Open the template with PowerBI desktop and fill in the information for the connections: it will load all the data in the model and produce a file that you can use to view the data even when the database is not available.
I created a custom xEvent script (save to a XEL-file), then converted the XEL using ConvertWorkload to a SQLite database. After this I tried SqlWorkload, using a FileWorkloadListener to pump the events into a schema to make it usable for WorkloadViewer, using the following JSON:
{
“Controller”: {
“Listener”:
{
“__type”: “FileWorkloadListener”,
“Source”: “C:\\SqlWorkload\\sqlWorkload_pb_0_132585610970760000.out”,
“SynchronizationMode”: “true”
}
,
“Consumers”:
[
{
“__type”: “AnalysisConsumer”,
“ConnectionInfo”:
{
“ServerName”: “W2016SQL2016-2\\SQL2019E”,
“DatabaseName”: “sqlWorkLoad”,
“SchemaName”: “SQL_7”
},
“UploadIntervalSeconds”: “120”
}
]
}
}
Whatever parameter setting I use, eventually I get:
Info – WorkloadTools.Consumer.Analysis.WorkloadAnalyzer : 25657 rows aggregated
Info – WorkloadTools.Consumer.Analysis.WorkloadAnalyzer : 31 rows written
Info – WorkloadTools.Consumer.Analysis.WorkloadAnalyzer : 130325 rows aggregated
Info – WorkloadTools.Consumer.Analysis.WorkloadAnalyzer : 4 rows written
Info – WorkloadTools.Consumer.Analysis.WorkloadAnalyzer : 131979 rows aggregated
Info – WorkloadTools.Consumer.Analysis.WorkloadAnalyzer : 7 rows written
Info – WorkloadTools.Consumer.Analysis.WorkloadAnalyzer : 126121 rows aggregated
Info – WorkloadTools.Consumer.Analysis.WorkloadAnalyzer : 2 rows written
Info – WorkloadTools.Consumer.Analysis.WorkloadAnalyzer : 74716 rows aggregated
Info – WorkloadTools.Consumer.Analysis.WorkloadAnalyzer : 4 rows written
Info – SqlWorkload.Program : Controller stopped.
Error – SqlWorkload.Program : System.Data.SqlClient.SqlException (0x80131904): Violation of PRIMARY KEY constraint ‘PK__Interval__6ED7FE586EEE611A’. Cannot insert duplicate key in object ‘SQL_7.Intervals’. The duplicate key value is (667407582).
What’s wrong?
Please help!!!
Thanks, Peter
Hi Peter, I ran into that issue myself but I have been unable to find the root cause. I will try to investigate it again and let you know.
I then suspected that in the default script is something that solves this issue, so I took this and just added a few custom events. Same problem … just for you ti know… Cheers, Peter
Hi
I’ve been investigating SqlWorkload. I like it and hope I can use it. It’s been working well, for the most part.
However, AnalysisConsumer throws an exception while processing events. Why is it generating and executing SQL that inserts a duplicate row? Is this something I can ignore?
As well, WorkloadViewer is not showing lines for the Baseline and Benchmark in any of the graphs. Why?
———————————————
System.Data.SqlClient.SqlException (0x80131904):violation of PRIMARY KEY constraint ‘PK__Interval__6ED7FE5843CC8967’. Cannot insrt duplicate key in object ‘baseline2008.Intervals’. The duplicate key value is(668247872).
——————————————–
exec sp_executesql N’INSERT INTO [baseline2008].[Intervals] (interval_id, end_time, duration_minutes) VALUES (@interval_id, @end_time, @duration_minutes); ‘,N’@interval_id int,@end_time datetime,@duration_minutes int’,
@interval_id=668247872,@end_time=’2021-03-05 08:24:32.843′,@duration_minutes=1
————————————–
{
“Controller”: {
“Listener”:
{
“__type”: “SqlTraceWorkloadListener”,
“ConnectionInfo”:
{
“ServerName”: “MyHostSQL2008R2”
},
“DatabaseFilter”: “MyDB”,
“TimeoutMinutes”:”60″
},
“Consumers”:
[
{
“__type”: “AnalysisConsumer”,
“ConnectionInfo”:
{
“ServerName”: “MyHostSQL2017”,
“DatabaseName”: “Analysis”,
“SchemaName”: “baseline2008”
},
“UploadIntervalSeconds”: 60
}
]
}
}
——————————————————
Thanks!
Update 1
The duplicate key error happens after pressing Ctrl-C.
Is this something I can ignore?
Update 2
WorkloadViewer is working fine… you need more than 1 one interval. 🙂
Hi Derek, Thanks for reaching out. Yes, the error happens when you press CTRL+C and I haven’t figured out yet how to fix it. I’ll keep you posted.
Hi
When doing workload analysis on a SQLServer 2008 R2 database, I get:
2021-03-09 14:54:24.4270 – Warn – WorkloadTools.Consumer.Analysis.WorkloadAnalyzer : Unable to write workload analysis.
2021-03-09 14:54:24.4270 – Warn – WorkloadTools.Consumer.Analysis.WorkloadAnalyzer : Incorrect syntax near ‘ROWS’.
Incorrect syntax near ‘ROWS’.
Incorrect syntax near ‘ROWS’.
Incorrect syntax near ‘ROWS’.
2021-03-09 14:54:24.4270 – Error – WorkloadTools.Consumer.Analysis.WorkloadAnalyzer : Unable to write workload analysis info to the destination database.
Is it possible to store AnalysisConsumer data on a SQL2008 R2 database?
Thanks!
Hi , we are running workload tool using SQL agent job , some how the temp files under local\temp folder is taking 20 GB space and causing disk space full.
I would really appreciate it if you could shed some light…
Error message:
—————————————-
2021-04-26 03:25:11.2886 – Error – WorkloadTools.Listener.ExtendedEvents.ExtendedEventsWorkloadListener : An exception occurred during event enumeration. Examine the inner exception for more information.
2021-04-26 03:25:11.4449 – Error – WorkloadTools.Listener.ExtendedEvents.ExtendedEventsWorkloadListener : at Microsoft.SqlServer.XEvent.Linq.Internal.XEventEnumerator.MoveNext()
at WorkloadTools.Listener.ExtendedEvents.StreamXEventDataReader.ReadEvents() in C:\GitHub\WorkloadTools\WorkloadTools\Listener\ExtendedEvents\StreamXEventDataReader.cs:line 44
at WorkloadTools.Listener.ExtendedEvents.ExtendedEventsWorkloadListener.ReadEvents() in C:\GitHub\WorkloadTools\WorkloadTools\Listener\ExtendedEvents\ExtendedEventsWorkloadListener.cs:line 274
2021-04-26 03:25:11.4449 – Error – WorkloadTools.Listener.ExtendedEvents.ExtendedEventsWorkloadListener : There is not enough space on the disk.
It looks like you are capturing too many events and WorkloadTools can’t process them quickly enough. Try filtering the events you are capturing using the DatabaseFilter/HostFilter/LoginFilter/ApplicationFilter properties.
Thanks.. Sure will check this.
If we stop and start the agent job it clears the temp file immediately.
Increasing UploadIntervalSeconds is 60 ,increasing this parameter will help.
I’m afraid it would do the opposite. Keeping the intervals small can help clear the queue
Pingback: Using WorkloadTools to Analyze a Workload – Curated SQL
Pingback: T-SQL Tuesday #147 – SQL Server Upgrade Strategies • SQLWATCH.IO