Blog Archives
Capturing a Workload with WorkloadTools
Last week I showed you how to use WorkloadTools to analyze a workload. As you have seen, using SqlWorkload to extract performance data from your workload is extremely easy and it just takes a few keystrokes in your favorite text editor to craft the perfect .json configuration file.
Today I’m going to show you how to capture a workload and save it to a file. If you’ve ever tried to perform this task with any other traditional benchmarking tool, like RML Utilities or Distributed Replay, your palms are probably sweaty already, but fear not: no complicated traces to set up, no hypertrophic scripts to create extended events captures. WorkloadTools makes it as easy as it can get.
Saving a workload to a file might look superfluous when you think that WorkloadTools has the ability to perform replays in real-time (I’ll discuss this feature in a future post), but there are situations when you want to replay the same exact workload multiple times, maybe changing something in the target database between each benchmark to see precisely what performance looks like under different conditions.
Another scenario where saving the workload to a file comes handy is when the source and destination servers are on different isolated networks and cannot communicate directly: in this case, you will save the workload to a file, copy it to the network where the target server resides and perform the replay there.
Choosing a file format
Before I show you how to do it, please allow me to explain what type of file we are going to write to and why I decided to use this format. If you’re not interested in this kind of geeky stuff, you can skip to the next section, no offense taken.
As already mentioned in my previous blog post, SqlWorkload uses a Listener object that relies on the underlying technology to capture the execution events that form the workload, so we have specialized Listeners for SqlTrace and for Extended Events. However, the Listener reads the events from the underlying source and then discards the source immediately.
When the workload is captured with an Extended Events session and the events are processed with the streaming API for Extended Events, it is pretty obvious how this works and why there is no .xel file at the end of the capture: the events are never written to a file and they are processed on the fly. In the same way, when the workload is captured with SqlTrace, SqlWorkload makes sure to keep the trace files on the server’s file system as shortly as possible, so it reads the events from the tail of the active rollover file and forwards them to the Consumers immediately: again, at the end of the capture, there will be no trace file available.
Long story short: using one of the traditional capture formats would require to instruct SQL Server to leave the files on the file system, which is not what we want and often something we cannot do.
Moreover, choosing one of the traditional formats (SqlTrace or Extended Events) would be problematic: Extended Events only works with SQLServer 2012 and newer and SqlTrace can only be read and written with an old 32 bit COM API.
What I decided to use as the intermediate format for SqlWorkload is a SqLite database, that contains a handful of tables that persist all the queries captured by the Listener. Yeah, sure: when you’re a database professional it feels very natural to use a database to store information (if all you have is a hammer, everything looks like a nail), but I can assure you that it is far from an unreasonable decision. Using a SqLite database allows you to inspect, modify and filter the workload data with extreme ease, using industry standard tools.
But enough talking about my decisional process: let’s go straight to the meat of this post.
Capturing a Workload
As you probably have guessed, capturing a workload is a matter of preparing a .json file with all the parameters and feeding it to SqlWorkload.
All you need is a Listener that captures the workload using SqlTrace or Extended Events and then a Consumer that takes care of writing to a SqLite file.
The .json file will be similar to this:
{
    "Controller": {

        "Listener":
        {
            // I'm using Extended Events here, but it could
            // be any type of listener
            "__type": "ExtendedEventsWorkloadListener",
            "ConnectionInfo":
            {
                "ServerName": "(local)"
            },
            "DatabaseFilter": "MyDatabase"
        },

        "Consumers":
        [
            {
                // The File Writer consumer takes care
                // of saving the workload to a file
                "__type": "WorkloadFileWriterConsumer",
                "OutputFile": "C:\\temp\\SqlWorkload.sqlite"
            }
        ]
    }
}
Once the configuration file is ready, you just need to pass its path as a command line argument to SqlWorkload and the Listener will start to forward all the events to the File Writer Consumer. You will see an output similar to this:

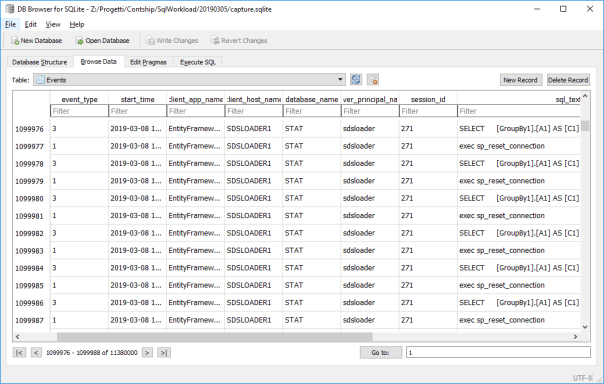
When you are done capturing the workload, you can stop SqlWorkload by pressing CTRL+C and you will be left with a SqLite file containing all your workload. You can actually open that file with a SqLite client of your choice and see what it contains. SqLite Browser is one of the possibilities, but there are countless options in Windows, Linux and Mac.
Converting an existing SqlTrace or Extended Events file
You are probably wondering what to do if you already have a set of SqlTrace or Extended Events files that describe your workload perfectly: you probably don’t want to capture the workload again just for the sake of using it with SqlWorkload. Don’t worry: WorkloadTools also contains a command line tool to convert .trc and .xel files to the SqLite format understood by SqlWorkload.
All you have to do is run ConvertWorkload and pass the path to the source file and the path to the output file.
Conclusions
Again, it couldn’t get easier than that: SqlWorkload provides a Consumer to capture your workload to a file for later use, be it a replay or analysis. All you have to do is fill some info in a .json file and SqlWorkload takes care of the rest for you.
In the next post we will see how to replay a workload using WorkloadTools and we will see how one of the possible sources for the replay can be in fact one of these SqLite files produced by the File Writer Consumer.
Stay tuned!
Workload analysis with WorkloadTools
Last week I introduced WorkloadTools and promised additional posts to describe what it can do in more detail. So, here we go: in this post I will show you how to use WorkloadTools to capture a workload and analyze it, in order to find things like the most resource-intensive queries or discover how the application behaves over time.
Capturing the workload
First of all, you need to capture the workload using SqlWorkload. As stated in the documentation, you need to provide a .json file that contains all the parameters needed to configure the Listener and the Consumers.
Configuring the Listener
You have two types of listeners to choose from in this case, and the choice will be determined mainly by the version of SQLServer that you’re working on: with older versions (up to SQLServer 2008 R2), you will have no choice but to use a SqlTraceWorkloadListener, because Extended Events do not provide the required events (sql_batch_completed in particular).
With newer versions (from SQLServer 2012 onwards), you can use an ExtendedEventsWorkloadListener.
Regardless of the type of Listener that you choose, there is not much information that you need to provide: the name of the server to connect to and the credentials are usually more than enough. The following json fragment shows a sample Listener configuration:
"Listener":
{
    // This line decides which type of Listener to use
    // Put the name of the class of your choice in this param
    "__type": "ExtendedEventsWorkloadListener",
    "ConnectionInfo":
    {
        // Server name and credentials
        "ServerName": "SQLDEMO\\SQL2014",
        "DatabaseName": "master",
        // Omit UserName and Password to use
        // Windows Authentication
        "UserName": "sa",
        "Password": "P4$$w0rd!"
    },
    // If you want to reduce the workload,
    // put some filters here
    "DatabaseFilter": "DS3"
}
Some things to note:
- The .json file accepts comments, even if the JSON standard does not allow comments. The file gets minified before reading, so all comments get stripped away. Comments are useful for describing what the file does and why it configures things in that particular way.
- Each Listener type accepts a different set of parameters. See the documentation for more details. Not all parameters are mandatory (optional parameters and their default value are described in square brackets).
- You do not need to configure, start and stop a particular trace or Extended Events session: SqlWorkload takes care of everything for you. If you really wanted to, you could override the default trace/session script (but most of the times you don’t want to do that)
- Filtering the source events is a good idea in several situations: it helps breaking down complex workloads by database, application, login or host.
Regardless of the type of Listener in use, the workload does not need to get completely written to a SqlTrace or Extended Events file before it can be used by the Listener, but the events are read from the Listener source incrementally, using different techniques, that depend on the Listener type.
For instance, for an ExtendedEventsWorkloadListener, the Listener uses the XE streaming API to read the events without having to save them to a file target first. For a SqlTraceWorkloadListener, the events need to go to a trace file first, but SqlWorkload makes sure to use small rollover files and always reads the tail of the last available file. The same happens with ExtendedEventsWorkloadListener when the FileTargetPath property is specified (this is mandatory for Azure SqlDatabase and must point to a blog storage URL).
Configuring the Consumers
All the events captured by the Listener are forwarded to all the Consumers registered on the Listener itself. You could have multiple Consumers for the same Listener, but in this example one Consumer is sufficient.
Your goal is to capture the workload on the source server and extract some information about the shape of the workload itself, looking for resource-intensive queries, long-running queries or queries that have a high number of executions. The correct Consumer type for this is the AnalysisConsumer.
This Consumer type can be configured in many aspects, but in its simplest form, it just needs to receive the name of the server, database and schema where the workload analysis tables will be created and populated. The schema name is important, because you may want to compare different benchmarks and the easiest way to do this is to save each benchmark to a different schema.
// Consumers are contained in a list
"Consumers":
[
    {
        // Choose the appropriate type of Consumer
        "__type": "AnalysisConsumer",
        // Fill in connection information
        "ConnectionInfo":
        {
            "ServerName": "SQLDEMO\\SQL2016",
            "DatabaseName": "SqlWorkload01",
            "SchemaName": "capture",
            "UserName": "sa",
            "Password": "P4$$w0rd!"
        },
        // This parameter controls how often the consumer
        // aggregates performance data and writes to the
        // analysis database
        "UploadIntervalSeconds": 60
    }
]
UploadIntervalSeconds is another important parameter, because it controls how often the workload analysis data is written to the destination database. AnalysisConsumer uses this parameter to time the creation of “intervals”: inside each interval, the performance data is aggregated by query, application, database, host name and login name.
The queries also get normalized during the analysis process: each constant or literal inside the query text gets replaced by a placeholder, which allows to aggregate together queries that differ only by the constant values. During the normalization process, SqlWorkload also calculates a 64 bit query hash, that can be used to retrieve the normalized query text and a sample query text captured before the normalization occurs.
Please note that, at the time of writing, the destination database does not get created automatically and needs to be created upfront. I am planning to remove this limitation, so keep an eye on this issue.
Putting it all together and starting SqlWorkload
Now that Listener and Consumer are configured, you just need to put it all together in a single .json file and pass it to SqlWorkload.
Here is the complete sqlworkload.json:
{
    "Controller": {

        "Listener":
        {
            "__type": "ExtendedEventsWorkloadListener",
            "ConnectionInfo":
            {
                "ServerName": "SQLDEMO\\SQL2014",
                "DatabaseName": "master",
                "UserName": "sa",
                "Password": "P4$$w0rd!"
            },
            "DatabaseFilter": "DS3"
        },

        "Consumers":
        [
            {
                "__type": "AnalysisConsumer",
                "ConnectionInfo":
                {
                    "ServerName": "SQLDEMO\\SQL2016",
                    "DatabaseName": "SqlWorkload01",
                    "SchemaName": "capture",
                    "UserName": "sa",
                    "Password": "P4$$w0rd!"
                },
                "UploadIntervalSeconds": 60
            }
        ]
    }
}
Now that file is ready, save it (e.g. analyze.json) and use it to run SqlWorkload:
"%programfiles%\workloadtools\sqlworkload.exe" --File "%cd%\analyze.json"
If everything is ok, SqlWorkload will start to print messages to the standard output of your cmd window:
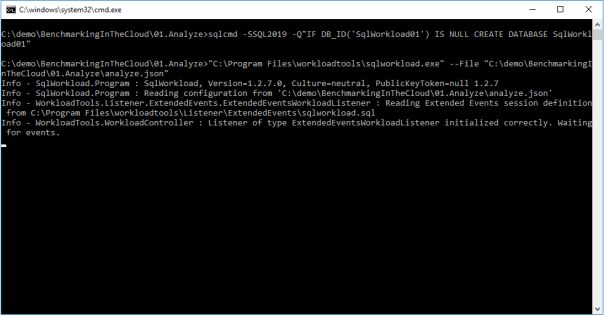
SqlWorkload also writes to a log file (SqlWorkload.log), that you will find in the working directory. You can control the log level and other logging parameters by editing NLog.config in the installation folder.
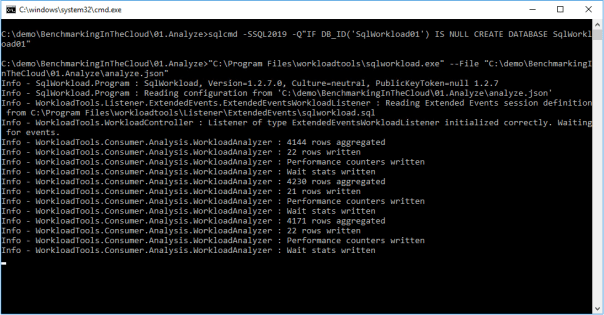
Every “UploadIntervalSeconds”, SqlWorkload will create a new interval, aggregate the performance data and upload everything to the analysis databases. You will see a message similar to this when the upload occurs:
When you think that the capture has lasted long enough, you can stop SqlWorkload by pressing CTRL+C. If you close the command window, it will not clean up the objects created for the capture, like Extended Events sessions or SqlTrace captures.
Another option is to specify a value for the optional parameter TimeoutMinutes on the Listener configuration: when the timeout expires, the capture will stop automatically.
Visualizing performance data with WorkloadViewer
Now that the analysis database contains the performance data, you can use WorkloadViewer to visualize it and draw your conclusions.
WorkloadViewer is a GUI tool that reads performance data from the analysis database and gives a graphical representation using charts and grids. It accepts a number of command line arguments that allow to automate its behavior, but it can be also opened without specifying any arguments: in this case, WorkloadViewer will present a form to fill the missing information.
WorkloadViewer can be used to visualize information about a single benchmark (analysis mode) or two benchmarks (comparison mode). In this case, you just need to work with a single benchmark, so it is enough to enter the connection info on the left, including the schema name where the tables are. When using Windows Authentication, you can leave UserName and Password blank.

WorkloadViewer shows data in three tabs:
- Workload
- Queries
- Query Details
The “Workload” tab shows three charts for total CPU, total duration and batches per second for each interval. This is useful to see how the workload evolves over time and identify any correlation between the three metrics.
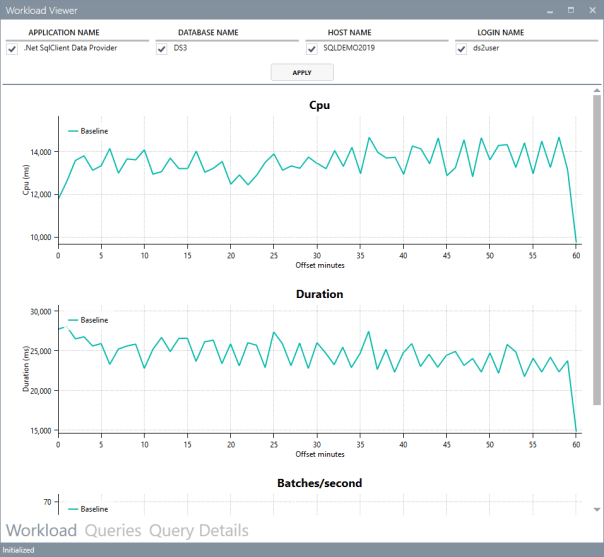
The charts support panning (click and drag with the right mouse button) and zooming (mouse wheel) as well as zooming to a particular area (click and drag with the middle mouse button). To reset zoom and pan, double click with the middle mouse button.
The “Queries” tab contains a grid that displays important metrics about the individual queries: avg/sum CPU, avg/sum Duration, avg/sum reads, total number of executions. These metrics are calculated over the entire workload.
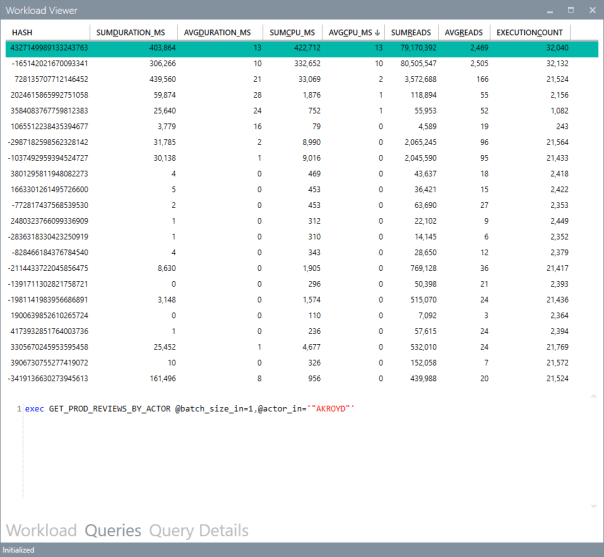
You can sort by a particular column by clicking the header: this allows you to rank queries by one of the metrics and identify immediately the top queries by that metric.
Clicking on one of the rows displays the query text on the bottom panel. Double clicking one of the rows takes you to the “Query Details” tab.

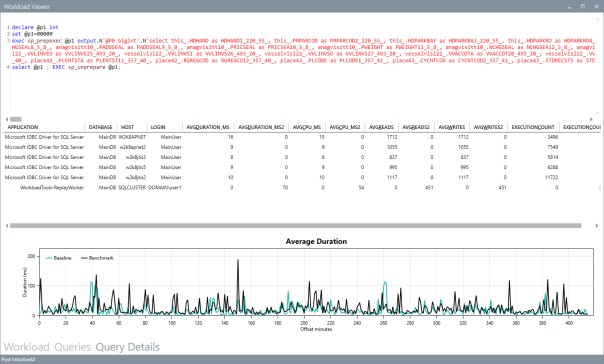
This tab displays information about the individual query: it contains the query text and the overall performance metrics, broken down by application name, database name, host name and login name.
The chart displays the average CPU usage over time.
WorkloadViewer is still heavily being worked on and it is not showing all the data available in the analysis database, but I hope to include more information in the future. If you feel adventurous enough, you can point PowerBI to the analysis database and produce a dashboard designed on your specific needs.
Conclusions
As you can see, WorkloadTools can be a valuable help when you need to analyze a workload. SqlWorkload allows you to capture all the data that you need with extreme ease, without having to configure anything other than basic connection information.
WorkloadViewer allows you to visualize the data in a convenient way and can give you an immediate overview of your workload, ranking queries by the most important performance metrics.
But this is only one of the many tasks that you can accomplish with WorkloadTools: in the weeks to come I will continue to write on this topic and I will show you how to unleash the full potential of WorkloadTools.
Stay tuned!
Benchmarking with WorkloadTools
If you ever tried to capture a benchmark on your SQL Server, you probably know that it is a complex operation. Not an impossible task, but definitely something that needs to be planned, timed and studied very thoroughly.
The main idea is that you capture a workload from production, you extract some performance information, then you replay the same workload to one or more environments that you want to put to test, while capturing the same performance information. At the end of the process, you can compare performance under different conditions, identify regressions, avoid unwanted situations and rate your tuning efforts.
A big part of the complexity, let’s face it, comes from the fact that the tools that we have had in our toolbelt so far are complex and suffer from a number of limitations that make this exercise very similar to a hurdle race.
If you want to replay a workload from production to test, you need to be able to capture the workload first. Even before you start, you’re already confronted with a myriad of questions:
- What do you use for this? A server-side trace? Extended events? Profiler maybe?
- Which events do you capture? Which fields?
- How long do you need to run the capture? How much is enough? One hour? One day? One week? One month?
- Can you apply some filters?
- Will you have enough disk space to store the captured data?
Throughout the years, you’ve had multiple tools for capturing workloads, each with its own strengths and limitations:
- Profiler
- GOOD: extremely easy to use
- BAD: non-negligible impact on the server
- Extended Events
- GOOD: lightweight
- BAD: not compatible with older versions of SQLServer
- SQL Trace
- GOOD: less impactful than profiler
- BAD: deprecated
However, capturing the workload is not enough: you need to be able to replay it and analyze/compare the performance data.
But fear not! You have some tools that can help you here:
- RML Utilities
- SQL Nexus
- Distributed Replay
- Database Experimentation Assistant (DEA)
The bad news is that (again) each of these tools has its limitations and hurdles, even if the tin says that any monkey could do it. There is nothing like running ReadTrace.exe or Dreplay.exe against a huge set of trace files, only to have it fail after two hours, without a meaningful error message (true story). Moreover, of all these tools, only Distributed Replay (and DEA, which is built on top of it) support Azure SqlDatabase and Azure Managed instances: if you’re working with Azure, be prepared to forget everything you know about traces and RML Utilities.
Introducing WorkloadTools
Throughout my career, I had to go through the pain of benchmarking often enough to get fed up with all the existing tools and decide to code my own. The result of this endeavor is WorkloadTools: a collection of tools to collect, analyze and replay SQL Server workloads, on premises and in the cloud.
At the moment, the project includes 3 tools:
- SqlWorkload – a command line tool to capture, replay and analyze a workload
- ConvertWorkload – a command line tool to convert existing workloads (traces and extended events) to the format used by SqlWorkload
- WorkloadViewer – a GUI tool to visualize and analyze workload data
SqlWorkload is different from the traditional tools, because it lets you choose the technology for the capture: SqlTrace, Extended Events or a pre-recorded workload file. SqlWorkload also lets you choose the platform that you prefer: it works with older versions of SqlServer (tested from 2008 onwards, but nothing prevents it from running on SqlServer 2000) and newer versions, like 2017 or 2019. But the groundbreaking feature of SqlWorkload is its ability to work with Azure Sql Database Managed Instances and Azure Sql Database, by capturing Extended Events on Azure blob storage.
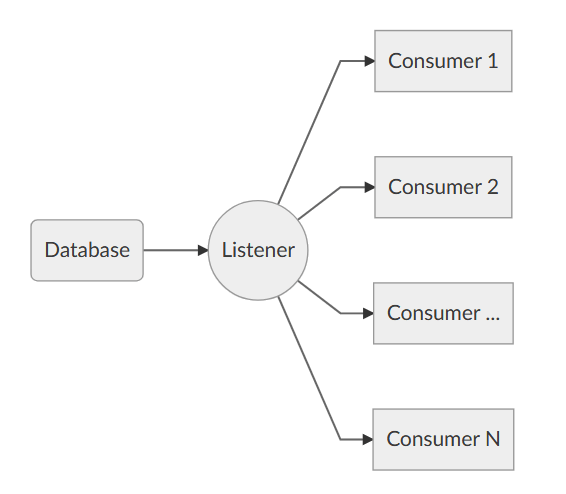
The capture is performed by a “Listener”, that reads the workload events from the source and forwards them immediately to a collection of “Consumers”, each specialized for performing a particular task on the events that it receives. You have a consumer for replaying the workload, a consumer for saving the workload to a file and a consumer for analyzing the workload to a database.
This flexible architecture allows you to do things differently from the existing tools. The traditional approach to benchmarking has always been:
- capture to one or more files
- analyze the files
- replay and capture
- analyze the files
- compare
SqlWorkload does not force you to save your workload to disk completely before you can start working with it, but it lets you forward the events to any type of consumer as soon as it is captured, thus enabling new types of workflows for your benchmarking activities. With SqlWorkload you are free to analyze the events while capturing, but you can also replay to a target database in real-time, while a second instance of SqlWorkload analyzes the events on the target.

If you’re used to a more traditional approach to benchmarking, you can certainly do things the usual way: you can capture a workload to a file, then use that file as a source for both the workload analysis and the replay. While replaying, you can capture the workload to a second set of files, that you can analyze to extract performance data. Another possibility is to analyze the workload directly while you capture it, writing to a workload file that you can use only for the replay.
As you can see, you have many possibilities and you are free to choose the solution that makes sense the most in your scenario. You may think that all this flexibility comes at the price of simplicity, but you’d be surprised by how easy it is to get started with WorkloadTools. SqlWorkload was designed to be as simple as possible, without having to learn and remember countless command line switches. Instead, it can be controlled by providing parameters in .JSON files, that can be saved, kept around and used as templates for the next benchmark.
For instance, the .JSON configuration file for “SqlWorkload A” in the picture above would look like this:
{
    "Controller": {

        "Listener":
        {
            "__type": "ExtendedEventsWorkloadListener",
            "ConnectionInfo":
            {
                "ServerName": "SourceServer",
                "DatabaseName": "SourceDatabase",
                "UserName": "sa",
                "Password": "P4$$w0rd!"
            },
            "DatabaseFilter": "SourceDatabase"
        },

        "Consumers":
        [
            {
                "__type": "ReplayConsumer",
                "ConnectionInfo":
                {
                    "ServerName": "TargetServer",
                    "DatabaseName": "TargetDatabase",
                    "UserName": "sa",
                    "Password": "Pa$$w0rd!"
                }
            },
            {
                "__type": "AnalysisConsumer",
                "ConnectionInfo":
                {
                    "ServerName": "AnalysisServer",
                    "DatabaseName": "AnalysisDatabase",
                    "SchemaName": "baseline",
                    "UserName": "sa",
                    "Password": "P4$$w0rd!"
                },
                "UploadIntervalSeconds": 60
            }
        ]
    }
}
As you can see, SqlWorkload expects very basic information and does not need to set up complex traces or XE sessions: all you have to do is configure what type of Listener to use and its parameters, then you need to specify which Consumers to use and their parameters (mainly connection details and credentials) and SqlWorkload will take care of the rest.
If you need to do control the process in more detail, you can certainly do so: the full list of parameters that you can specify in .JSON files is available in the documentation of SqlWorkload at GitHub.
Once the capture is over and you completely persisted the workload analysis to a database, you can use WorkloadViewer to visualize it. WorkloadViewer will show you charts for Cpu, Duration and Batches/sec, comparing how the two benchmarks performed. You can also use the filters at the top to focus the analysis on a subset of the data or you can zoom and pan on the horizontal axis to select a portion of the workload to analyze.

You can also use the “Queries” tab to see an overview of the individual batches captured in the workload. For each of those batches, you’ll be able to see the text of the queries and you will see stats for cpu, duration, reads, writes and number of executions. Sorting by any of these columns will let you spot immediately the regressions between the baseline and the benchmark and you will know exactly where to start tuning.

If you double click one of the queries, you will go to the Query Details tab, which will show you additional data about the selected query, along with its performance over time:
If WorkloadViewer is not enough for you, the project also includes a PowerBI dashboard that you can use to analyze the data from every angle. Does it look exciting enough? Wait, there’s more…
If you already have a pre-captured workload in any format (SqlTrace or Extended Events) you can use the command line tool ConvertWorkload to create a new workload file in the intermediate format used and understood by SqlWorkload (spoiler: it’s a SqLite database), in order to use it as the source for a WorkloadFileListener. This means that you can feed your existing trace data to the WorkloadTools analysis database, or replay it to a test database, even if the workload was not captured with WorkloadTools in the first place.
We have barely scratched the surface of what WorkloadTools can do: in the next weeks I will post detailed information on how to perform specific tasks with WorkloadTools, like capturing to a workload file or performing a real-time replay. In the meantime, you can read the documentation or you can join me at SqlBits, where I will introduce WorkloadTools during my session.
Stay tuned!
Please Throw this Hardware at the Problem

We’re being told over and over that “throwing hardware at the problem” is not the correct solution for performance problems and a 2x faster server will not make our application twice as fast. Quite true, but there’s one thing that we can do very easily without emptying the piggy bank and won’t hurt for sure: buying more RAM.
The price for server-class RAM has dropped so dramatically that today you can buy a 16 GB module for around € 200. Depending on the architecture of your server, you could max out the memory supported by a standard edition (128 GB) with just € 1,600.
Isn’t it a reasonable price for better performance?
Let’s put it in perspective: you decide that throwing hardware at the problem is not right, so you hire a consultant to tune performance. How many days of his work can you buy with € 1,600? Two? One? How much tuning work will he do in one or two days? Do you want him to work on the core issues or fight with memory pressure? RAM is cheap, consultants are not: make them work on what really matters for you.
Does adding RAM always make sense? No: if your server has 4 GB of data and 16 GB of RAM, there’s no need to add more RAM and if you do you won’t see any improvement. On the other hand, if you have 100 GB of data and 32 GB of RAM, you should be upgrading right away. Isn’t your business worth € 1.600? You’re probably paying much more for SQL Server licensing, so why waste your money on a license that has to run on an underpowered machine? RAM is cheap, SQL Server licenses are not: let your license work on a good machine.
Will it make a huge difference? It depends: if the server is already under heavy memory pressure, you will see a big improvement. Even if memory pressure is not the worst issue on your server, you will see a big difference for those queries that access data not used frequently: if you don’t have enough RAM, that data will probably live outside the buffer cache and will have to be read from disk. RAM is cheap, faster disks are incredibly expensive: let the RAM work and the disks sit idle.
That said, what I see in the wild is lots and lots of production servers with 8 GB of RAM or less. Many of those servers have been installed a few years ago, when RAM was pricier than today, but there’s no reason why you shouldn’t upgrade them now. Upgrading the CPU has an impact on the SQL Server licensing, while adding more RAM doesn’t require additional licensing fees. See? RAM is cheap.
On the other hand, we have many servers running on virtual machines at hosting/cloud facilities, where you pay for machine specs. Something has to change here as well: hosting companies are offering too few RAM in their machines and the configurations with more memory are crazily expensive. Dear hosting/cloud companies, open your eyes: RAM is ridiculously cheap!
Call to action:
Did I mention that RAM is cheap? Check your servers: are they running on less than € 200 of RAM? It’s time to upgrade NOW!
Using QUERYTRACEON in plan guides
Yesterday the CSS team made the QUERYTRACEON hint publicly documented.
This means that now it’s officially supported and you can use it in production code.
After reading the post on the CSS blog, I started to wonder whether there is some actual use in production for this query hint, given that it requires the same privileges as DBCC TRACEON, which means you have to be a member of the sysadmin role.
In fact, if you try to use that hint when connected as a low privileged user, you get a very precise error message, that leaves no room for interpretation:
SELECT *
FROM [AdventureWorks2012].[Person].[Person]
OPTION (QUERYTRACEON 4199)
Msg 2571, Level 14, State 3, Line 1
User ‘guest’ does not have permission to run DBCC TRACEON.
How can a query hint available to sysadmins only be possibly useful for production?
I posted my doubt on Twitter using the #sqlhelp hashtag and got interesting replies from Paul Randal, Paul White and Robert Davis.
My concerns were not about the usefulness of the hint per se, but about the usefulness in production code. Often 140 chars are not enough when you want to express your thoughts clearly, in fact I decided to write this blog post to clarify what I mean.
As we have seen, the QUERYTRACEON query hint cannot be used directly by users not in the sysadmin role, but it can be used in stored procedures with “EXECUTE AS owner” and in plan guides.
While it’s completely clear what happens when the hint is used in procedures executed in the context of the owner, what happens in plan guides is not so obvious (at least, not to me). In fact, given that the secuirty context is not changed when the plan guide is matched and applied, I would have expected it to fail miserably when executed by a low privileged user, but it’s not the case.
Let’s try and see what happens:
First of all we need a query “complex enough” to let the optimizer take plan guides into account. A straight “SELECT * FROM table” and anything else that results in a trivial plan won’t be enough.
SELECT *
FROM [Person].[Person] AS P
INNER JOIN [Person].[PersonPhone] AS H
    ON P.BusinessEntityID = H.BusinessEntityID
INNER JOIN [Person].[BusinessEntity] AS BE
    ON P.BusinessEntityID = BE.BusinessEntityID
INNER JOIN [Person].[BusinessEntityAddress] AS BEA
    ON BE.BusinessEntityID = BEA.BusinessEntityID
WHERE BEA.ModifiedDate > '20080101'
Then we need a plan guide to apply the QUERYTRACEON hint:
EXEC sp_create_plan_guide @name = N'[querytraceon]', @stmt = N'SELECT *
FROM [Person].[Person] AS P
INNER JOIN [Person].[PersonPhone] AS H
	ON P.BusinessEntityID = H.BusinessEntityID
INNER JOIN [Person].[BusinessEntity] AS BE
	ON P.BusinessEntityID = BE.BusinessEntityID
INNER JOIN [Person].[BusinessEntityAddress] AS BEA
	ON BE.BusinessEntityID = BEA.BusinessEntityID
WHERE BEA.ModifiedDate > ''20080101''', @type = N'SQL', @hints = N'OPTION (QUERYTRACEON 4199)'
If we enable the plan guide and try to issue this query in the context of a low privileged user, we can see no errors thrown any more:
CREATE LOGIN testlogin WITH PASSWORD = 'testlogin123';
GO
USE AdventureWorks2012;
GO
CREATE USER testlogin FOR LOGIN testlogin;
GO
GRANT SELECT TO testlogin;
GO
EXECUTE AS USER = 'testlogin';
GO
SELECT *
FROM [Person].[Person] AS P
INNER JOIN [Person].[PersonPhone] AS H
    ON P.BusinessEntityID = H.BusinessEntityID
INNER JOIN [Person].[BusinessEntity] AS BE
    ON P.BusinessEntityID = BE.BusinessEntityID
INNER JOIN [Person].[BusinessEntityAddress] AS BEA
    ON BE.BusinessEntityID = BEA.BusinessEntityID
WHERE BEA.ModifiedDate > '20080101';
GO
REVERT;
GO
If we open a profiler trace and capture the “Plan Guide Successful” and “Plan Guide Unsuccessful” events, we can see that the optimizer matches the plan guide and enforces the use of the query hint.
Lesson learned: even if users are not allowed to issue that particular query hint directly, adding it to a plan guide is a way to let anyone use it indirectly.
Bottom line is OPTION QUERYTRACEON can indeed be very useful when we identify some queries that obtain a decent query plan only when a specific trace flag is active and we don’t want to enable it for the whole instance. In those cases, a plan guide or a stored procedure in the owner’s context can be the answer.
