Blog Archives
Workload analysis with WorkloadTools
Last week I introduced WorkloadTools and promised additional posts to describe what it can do in more detail. So, here we go: in this post I will show you how to use WorkloadTools to capture a workload and analyze it, in order to find things like the most resource-intensive queries or discover how the application behaves over time.
Capturing the workload
First of all, you need to capture the workload using SqlWorkload. As stated in the documentation, you need to provide a .json file that contains all the parameters needed to configure the Listener and the Consumers.
Configuring the Listener
You have two types of listeners to choose from in this case, and the choice will be determined mainly by the version of SQLServer that you’re working on: with older versions (up to SQLServer 2008 R2), you will have no choice but to use a SqlTraceWorkloadListener, because Extended Events do not provide the required events (sql_batch_completed in particular).
With newer versions (from SQLServer 2012 onwards), you can use an ExtendedEventsWorkloadListener.
Regardless of the type of Listener that you choose, there is not much information that you need to provide: the name of the server to connect to and the credentials are usually more than enough. The following json fragment shows a sample Listener configuration:
"Listener":
{
    // This line decides which type of Listener to use
    // Put the name of the class of your choice in this param
    "__type": "ExtendedEventsWorkloadListener",
    "ConnectionInfo":
    {
        // Server name and credentials
        "ServerName": "SQLDEMO\\SQL2014",
        "DatabaseName": "master",
        // Omit UserName and Password to use
        // Windows Authentication
        "UserName": "sa",
        "Password": "P4$$w0rd!"
    },
    // If you want to reduce the workload,
    // put some filters here
    "DatabaseFilter": "DS3"
}
Some things to note:
- The .json file accepts comments, even if the JSON standard does not allow comments. The file gets minified before reading, so all comments get stripped away. Comments are useful for describing what the file does and why it configures things in that particular way.
- Each Listener type accepts a different set of parameters. See the documentation for more details. Not all parameters are mandatory (optional parameters and their default value are described in square brackets).
- You do not need to configure, start and stop a particular trace or Extended Events session: SqlWorkload takes care of everything for you. If you really wanted to, you could override the default trace/session script (but most of the times you don’t want to do that)
- Filtering the source events is a good idea in several situations: it helps breaking down complex workloads by database, application, login or host.
Regardless of the type of Listener in use, the workload does not need to get completely written to a SqlTrace or Extended Events file before it can be used by the Listener, but the events are read from the Listener source incrementally, using different techniques, that depend on the Listener type.
For instance, for an ExtendedEventsWorkloadListener, the Listener uses the XE streaming API to read the events without having to save them to a file target first. For a SqlTraceWorkloadListener, the events need to go to a trace file first, but SqlWorkload makes sure to use small rollover files and always reads the tail of the last available file. The same happens with ExtendedEventsWorkloadListener when the FileTargetPath property is specified (this is mandatory for Azure SqlDatabase and must point to a blog storage URL).
Configuring the Consumers
All the events captured by the Listener are forwarded to all the Consumers registered on the Listener itself. You could have multiple Consumers for the same Listener, but in this example one Consumer is sufficient.
Your goal is to capture the workload on the source server and extract some information about the shape of the workload itself, looking for resource-intensive queries, long-running queries or queries that have a high number of executions. The correct Consumer type for this is the AnalysisConsumer.
This Consumer type can be configured in many aspects, but in its simplest form, it just needs to receive the name of the server, database and schema where the workload analysis tables will be created and populated. The schema name is important, because you may want to compare different benchmarks and the easiest way to do this is to save each benchmark to a different schema.
// Consumers are contained in a list
"Consumers":
[
    {
        // Choose the appropriate type of Consumer
        "__type": "AnalysisConsumer",
        // Fill in connection information
        "ConnectionInfo":
        {
            "ServerName": "SQLDEMO\\SQL2016",
            "DatabaseName": "SqlWorkload01",
            "SchemaName": "capture",
            "UserName": "sa",
            "Password": "P4$$w0rd!"
        },
        // This parameter controls how often the consumer
        // aggregates performance data and writes to the
        // analysis database
        "UploadIntervalSeconds": 60
    }
]
UploadIntervalSeconds is another important parameter, because it controls how often the workload analysis data is written to the destination database. AnalysisConsumer uses this parameter to time the creation of “intervals”: inside each interval, the performance data is aggregated by query, application, database, host name and login name.
The queries also get normalized during the analysis process: each constant or literal inside the query text gets replaced by a placeholder, which allows to aggregate together queries that differ only by the constant values. During the normalization process, SqlWorkload also calculates a 64 bit query hash, that can be used to retrieve the normalized query text and a sample query text captured before the normalization occurs.
Please note that, at the time of writing, the destination database does not get created automatically and needs to be created upfront. I am planning to remove this limitation, so keep an eye on this issue.
Putting it all together and starting SqlWorkload
Now that Listener and Consumer are configured, you just need to put it all together in a single .json file and pass it to SqlWorkload.
Here is the complete sqlworkload.json:
{
    "Controller": {

        "Listener":
        {
            "__type": "ExtendedEventsWorkloadListener",
            "ConnectionInfo":
            {
                "ServerName": "SQLDEMO\\SQL2014",
                "DatabaseName": "master",
                "UserName": "sa",
                "Password": "P4$$w0rd!"
            },
            "DatabaseFilter": "DS3"
        },

        "Consumers":
        [
            {
                "__type": "AnalysisConsumer",
                "ConnectionInfo":
                {
                    "ServerName": "SQLDEMO\\SQL2016",
                    "DatabaseName": "SqlWorkload01",
                    "SchemaName": "capture",
                    "UserName": "sa",
                    "Password": "P4$$w0rd!"
                },
                "UploadIntervalSeconds": 60
            }
        ]
    }
}
Now that file is ready, save it (e.g. analyze.json) and use it to run SqlWorkload:
"%programfiles%\workloadtools\sqlworkload.exe" --File "%cd%\analyze.json"
If everything is ok, SqlWorkload will start to print messages to the standard output of your cmd window:
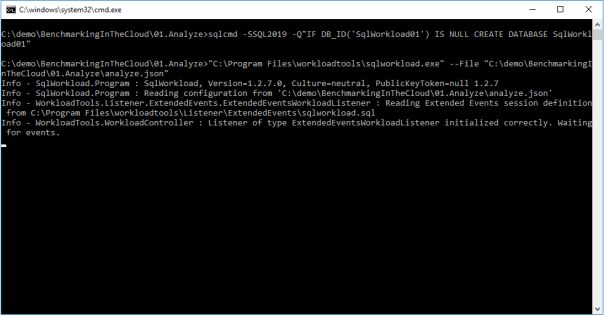
SqlWorkload also writes to a log file (SqlWorkload.log), that you will find in the working directory. You can control the log level and other logging parameters by editing NLog.config in the installation folder.
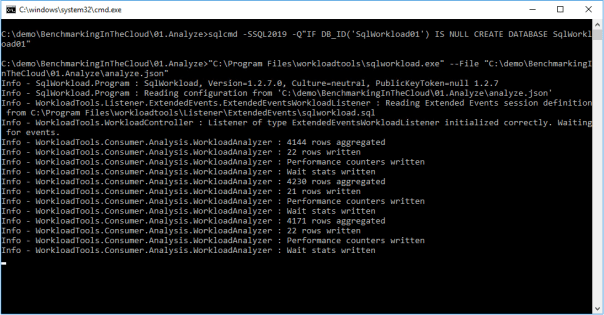
Every “UploadIntervalSeconds”, SqlWorkload will create a new interval, aggregate the performance data and upload everything to the analysis databases. You will see a message similar to this when the upload occurs:
When you think that the capture has lasted long enough, you can stop SqlWorkload by pressing CTRL+C. If you close the command window, it will not clean up the objects created for the capture, like Extended Events sessions or SqlTrace captures.
Another option is to specify a value for the optional parameter TimeoutMinutes on the Listener configuration: when the timeout expires, the capture will stop automatically.
Visualizing performance data with WorkloadViewer
Now that the analysis database contains the performance data, you can use WorkloadViewer to visualize it and draw your conclusions.
WorkloadViewer is a GUI tool that reads performance data from the analysis database and gives a graphical representation using charts and grids. It accepts a number of command line arguments that allow to automate its behavior, but it can be also opened without specifying any arguments: in this case, WorkloadViewer will present a form to fill the missing information.
WorkloadViewer can be used to visualize information about a single benchmark (analysis mode) or two benchmarks (comparison mode). In this case, you just need to work with a single benchmark, so it is enough to enter the connection info on the left, including the schema name where the tables are. When using Windows Authentication, you can leave UserName and Password blank.

WorkloadViewer shows data in three tabs:
- Workload
- Queries
- Query Details
The “Workload” tab shows three charts for total CPU, total duration and batches per second for each interval. This is useful to see how the workload evolves over time and identify any correlation between the three metrics.
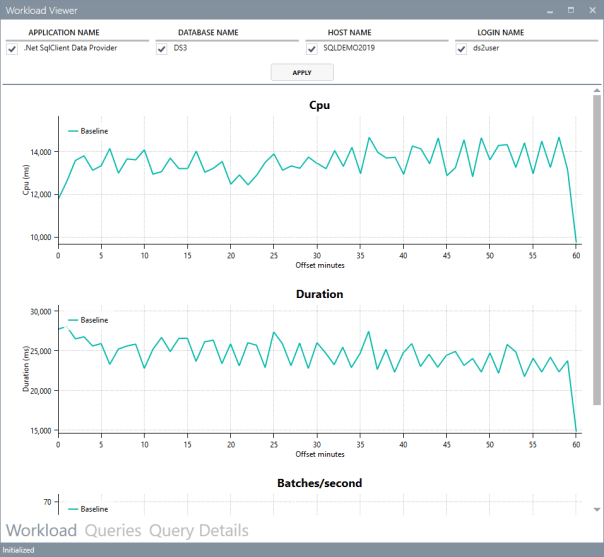
The charts support panning (click and drag with the right mouse button) and zooming (mouse wheel) as well as zooming to a particular area (click and drag with the middle mouse button). To reset zoom and pan, double click with the middle mouse button.
The “Queries” tab contains a grid that displays important metrics about the individual queries: avg/sum CPU, avg/sum Duration, avg/sum reads, total number of executions. These metrics are calculated over the entire workload.
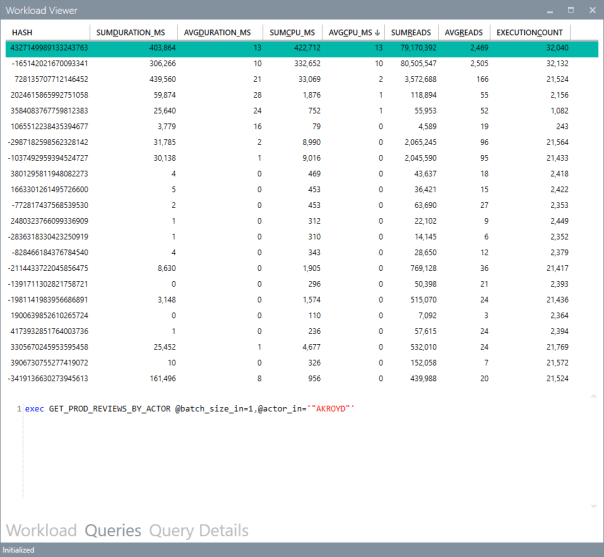
You can sort by a particular column by clicking the header: this allows you to rank queries by one of the metrics and identify immediately the top queries by that metric.
Clicking on one of the rows displays the query text on the bottom panel. Double clicking one of the rows takes you to the “Query Details” tab.

This tab displays information about the individual query: it contains the query text and the overall performance metrics, broken down by application name, database name, host name and login name.
The chart displays the average CPU usage over time.
WorkloadViewer is still heavily being worked on and it is not showing all the data available in the analysis database, but I hope to include more information in the future. If you feel adventurous enough, you can point PowerBI to the analysis database and produce a dashboard designed on your specific needs.
Conclusions
As you can see, WorkloadTools can be a valuable help when you need to analyze a workload. SqlWorkload allows you to capture all the data that you need with extreme ease, without having to configure anything other than basic connection information.
WorkloadViewer allows you to visualize the data in a convenient way and can give you an immediate overview of your workload, ranking queries by the most important performance metrics.
But this is only one of the many tasks that you can accomplish with WorkloadTools: in the weeks to come I will continue to write on this topic and I will show you how to unleash the full potential of WorkloadTools.
Stay tuned!
A bug in merge replication with FILESTREAM data
I wish I could say that every DBA has a love/hate relationship with Replication, but, let’s face it, it’s only hate. But it could get worse: it could be Merge Replication. Or even worse: Merge Replication with FILESTREAM.
What could possibly top all this hatred and despair if not a bug? Well, I happened to find one, that I will describe here.
The scenario
I published tables with FILESTREAM data before, but it seems like there is a particular planetary alignment that triggers an error during the execution of the snapshot agent.
This unlikely combination consists in a merge article with a FILESTREAM column and two UNIQUE indexes on the ROWGUIDCOL column. Yes, I know that generally it does not make sense to have two indexes on the same column, but this happened to be one of the cases where it did, so we had a CLUSTERED PRIMARY KEY on the uniqueidentifier column decorated with the ROWGUIDCOL attribute and, on top, one more NONCLUSTERED UNIQUE index on the same column, backed by a UNIQUE constraint.
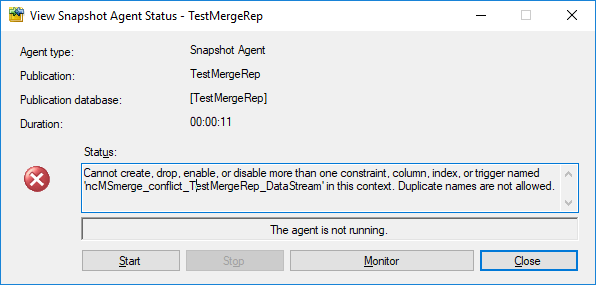
Setting up the publication does not throw any error, but generating the initial snapshot for the publication does:
Cannot create, drop, enable, or disable more than one constraint,
column, index, or trigger named 'ncMSmerge_conflict_TestMergeRep_DataStream'
in this context. Duplicate names are not allowed.
Basically, the snapshot agent is complaining about the uniqueness of the name of one of the indexes it is trying to create on the conflict table. The interesting fact about this bug is that it doesn’t appear when the table has no FILESTREAM column and it doesn’t appear when the table doesn’t have the redundant UNIQUE constraint on the ROWGUID column: both conditions need to be met.
The script
Here is the full script to reproduce the bug.
Before you run it, make sure that:
- FILESTREAM is enabled
- Distribution is configured
This file contains hidden or bidirectional Unicode text that may be interpreted or compiled differently than what appears below. To review, open the file in an editor that reveals hidden Unicode characters.
Learn more about bidirectional Unicode characters
| USE master; | |
| GO | |
| — | |
| — CLEANUP | |
| — | |
| IF DB_ID('TestMergeRep') IS NOT NULL | |
| BEGIN | |
| BEGIN TRY | |
| exec TestMergeRep.sys.sp_dropmergepublication @publication=N'TestMergeRep'; | |
| END TRY | |
| BEGIN CATCH | |
| PRINT 'sp_dropmergepublication failed' | |
| END CATCH | |
| BEGIN TRY | |
| exec TestMergeRep.sys.sp_removedbreplication 'TestMergeRep', 'merge'; | |
| END TRY | |
| BEGIN CATCH | |
| PRINT 'sp_removedbreplication failed' | |
| END CATCH | |
| BEGIN TRY | |
| exec TestMergeRep.sys.sp_replicationdboption @dbname = N'TestMergeRep', @optname = N'merge publish', @value = N'false'; | |
| END TRY | |
| BEGIN CATCH | |
| PRINT 'sp_replicationdboption failed' | |
| END CATCH | |
| ALTER DATABASE TestMergeRep SET SINGLE_USER WITH ROLLBACK IMMEDIATE; | |
| DROP DATABASE TestMergeRep; | |
| END | |
| GO | |
| — | |
| — CREATE DATABASE | |
| — | |
| CREATE DATABASE TestMergeRep; | |
| GO | |
| — WE NEED A FILESTREAM FILEGROUP | |
| DECLARE @path nvarchar(128), @sql nvarchar(max); | |
| SELECT @path = LEFT(physical_name, LEN(physical_name) – CHARINDEX('\', REVERSE(physical_name),1) + 1) | |
| FROM sys.database_files | |
| WHERE type = 0 | |
| ALTER DATABASE TestMergeRep | |
| ADD | |
| FILEGROUP [TestmergeRep_FileStream01] CONTAINS FILESTREAM; | |
| SET @sql = ' | |
| ALTER DATABASE TestMergeRep | |
| ADD | |
| FILE | |
| ( NAME = N''TestmergeRep_FS01'', FILENAME = ''' + @path + 'TestMergeRep_FS01'' , MAXSIZE = UNLIMITED) | |
| TO FILEGROUP [TestmergeRep_FileStream01]; | |
| ' | |
| EXEC(@sql) | |
| — | |
| — CREATE TABLE | |
| — | |
| USE TestMergeRep; | |
| GO | |
| SET ANSI_NULLS ON | |
| GO | |
| SET QUOTED_IDENTIFIER ON | |
| GO | |
| CREATE TABLE [dbo].[DataStream]( | |
| [DataStreamGUID] [uniqueidentifier] ROWGUIDCOL NOT NULL, | |
| [ValueData] [varbinary](max) FILESTREAM NOT NULL, | |
| CONSTRAINT [DataStream_DataStream_PK] PRIMARY KEY CLUSTERED | |
| ( | |
| [DataStreamGUID] ASC | |
| ) | |
| ) | |
| GO | |
| — I know it doesn't make sense, but the bug only shows | |
| — when the table has a second UNIQUE constraint on the PK column | |
| ALTER TABLE [DataStream] ADD CONSTRAINT UQ_MESL_DataStreamPK UNIQUE ([DataStreamGUID]); | |
| — WORKAROUND: create the UNIQUE index without creating the UNIQUE constraint: | |
| –CREATE UNIQUE NONCLUSTERED INDEX UQ_MESL_DataStreamPK ON [DataStream] ([DataStreamGUID]); | |
| — | |
| — SET UP REPLICATION | |
| — | |
| USE master | |
| EXEC sp_replicationdboption | |
| @dbname = N'TestMergeRep', | |
| @optname = N'merge publish', | |
| @value = N'true'; | |
| use [TestMergeRep] | |
| exec sp_addmergepublication | |
| @publication = N'TestMergeRep', | |
| @description = N'Merge publication of database TestMergeRep.', | |
| @retention = 30, | |
| @sync_mode = N'native', | |
| @allow_push = N'true', | |
| @allow_pull = N'true', | |
| @allow_anonymous = N'false', | |
| @enabled_for_internet = N'false', | |
| @conflict_logging = N'publisher', | |
| @dynamic_filters = N'false', | |
| @snapshot_in_defaultfolder = N'true', | |
| @compress_snapshot = N'false', | |
| @ftp_port = 21, | |
| @ftp_login = N'anonymous', | |
| @conflict_retention = 14, | |
| @keep_partition_changes = N'false', | |
| @allow_subscription_copy = N'false', | |
| @allow_synctoalternate = N'false', | |
| @add_to_active_directory = N'false', | |
| @max_concurrent_merge = 0, | |
| @max_concurrent_dynamic_snapshots = 0, | |
| @publication_compatibility_level = N'100RTM', | |
| @use_partition_groups = N'false'; | |
| exec sp_addpublication_snapshot | |
| @publication = N'TestMergeRep', | |
| @frequency_type = 1, | |
| @frequency_interval = 1, | |
| @frequency_relative_interval = 1, | |
| @frequency_recurrence_factor = 1, | |
| @frequency_subday = 1, | |
| @frequency_subday_interval = 5, | |
| @active_start_date = 0, | |
| @active_end_date = 0, | |
| @active_start_time_of_day = 10000, | |
| @active_end_time_of_day = 235959; | |
| exec sp_addmergearticle | |
| @publication = N'TestMergeRep', | |
| @article = N'DataStream', | |
| @source_owner = N'dbo', | |
| @source_object = N'DataStream', | |
| @type = N'table', | |
| @description = null, | |
| @column_tracking = N'true', | |
| @pre_creation_cmd = N'drop', | |
| @creation_script = null, | |
| @schema_option = 0x000000010C034FD1, | |
| @article_resolver = null, | |
| @subset_filterclause = N'', | |
| @vertical_partition = N'false', | |
| @destination_owner = N'dbo', | |
| @verify_resolver_signature = 0, | |
| @allow_interactive_resolver = N'false', | |
| @fast_multicol_updateproc = N'true', | |
| @check_permissions = 0, | |
| @identityrangemanagementoption = 'manual', | |
| @delete_tracking = N'true', | |
| @stream_blob_columns = N'false', | |
| @force_invalidate_snapshot = 1; | |
| — Sets all merge jobs owned by sa | |
| DECLARE @job_id uniqueidentifier | |
| DECLARE c CURSOR STATIC LOCAL FORWARD_ONLY READ_ONLY | |
| FOR | |
| SELECT job_id | |
| FROM msdb.dbo.sysjobs AS sj | |
| INNER JOIN msdb.dbo.syscategories AS sc | |
| ON sj.category_id = sc.category_id | |
| WHERE sc.name = 'REPL-Merge'; | |
| OPEN c | |
| FETCH NEXT FROM c INTO @job_id | |
| WHILE @@FETCH_STATUS = 0 | |
| BEGIN | |
| EXEC msdb.dbo.sp_update_job @job_id=@job_id , @owner_login_name=N'sa' | |
| FETCH NEXT FROM c INTO @job_id | |
| END | |
| CLOSE c | |
| DEALLOCATE c |
After running the script, start the snapshot agent and you’ll see the error appearing:
Workaround
One way to get rid of the bug is to enforce the uniqueness of the data by using a UNIQUE index instead of a UNIQUE constraint:
CREATE UNIQUE NONCLUSTERED INDEX UQ_MESL_DataStreamPK
ON [DataStream] ([DataStreamGUID]);
With this index, the snapshot agent completes correctly. Please note that the index would have been UNIQUE anyway, because its key is a superset of the primary key.
Hope this helps!
Please Vote!
This bug has been filed on UserVoice and can be found here: https://feedback.azure.com/forums/908035-sql-server/suggestions/34735489-bug-in-merge-replication-snapshot-agent-with-files
Please upvote it!
How To Enlarge Your Columns With No Downtime
Let’s face it: column enlargement is a very sensitive topic. I get thousands of emails every month on this particular topic, although most of them end up in my spam folder. Go figure…
The inconvenient truth is that enlarging a fixed size column is a long and painful operation, that will make you wish there was a magic lotion or pill to use on your column to enlarge it on the spot.
Unfortunately, there is no such magic pill, but turns out you can use some SQL Server features to make the column enlargement less painful for your users.
First, let’s create a table with one smallint column, that we will try to enlarge later.
-- Go to a safe place
USE tempdb;
GO

IF OBJECT_ID('EnlargeTest') IS NOT NULL
    DROP TABLE EnlargeTest;

-- Create test table
CREATE TABLE EnlargeTest (
    SomeColumn smallint
);

-- Insert 1 million rows
INSERT INTO EnlargeTest (SomeColumn)
SELECT TOP(1000000) 1
FROM master.dbo.spt_values AS A
CROSS JOIN master.dbo.spt_values AS B;
If you try to enlarge this column with a straight “ALTER TABLE” command, you will have to wait for SQLServer to go through all the rows and write the new data type. Smallint is a data type that is stored in 2 bytes, while int requires 4 bytes, so SQL Server will have to enlarge each and every row to accommodate 2 extra bytes.
This operation requires some time and also causes a lot of page splits, especially if the pages are completely full.
SET STATISTICS IO, TIME ON;

-- Enlarge column
ALTER TABLE EnlargeTest ALTER COLUMN SomeColumn int;

SET STATISTICS IO, TIME OFF;

/*

(1000000 rows affected)
SQL Server parse and compile time:
   CPU time = 0 ms, elapsed time = 0 ms.
Table 'EnlargeTest'. Scan count 9, logical reads 3001171, physical reads 0, read-ahead reads 0, lob logical reads 0, lob physical reads 0, lob read-ahead reads 0.
Table 'Worktable'. Scan count 8, logical reads 2064041, physical reads 0, read-ahead reads 0, lob logical reads 0, lob physical reads 0, lob read-ahead reads 0.

 SQL Server Execution Times:
   CPU time = 13094 ms,  elapsed time = 11012 ms.

 */
The worst part of this approach is that, while the ALTER TABLE statement is running, nobody can access the table.
To overcome this inconvenience, there is a magic column enlargement pill that your table can take, and it’s called Row Compression.

Row compression pills. They used to be expensive, SQL Server 2016 SP1 made them cheap.
Let’s try and revert to the original column size and take the Row Compression pill:
-- Let's revert to smallint
ALTER TABLE EnlargeTest ALTER COLUMN SomeColumn smallint;

-- Add row compression
ALTER TABLE EnlargeTest REBUILD WITH (DATA_COMPRESSION = ROW);
With Row Compression, your fixed size columns can use only the space needed by the smallest data type where the actual data fits. This means that for an int column that contains only smallint data, the actual space usage inside the row is 1 or 2 bytes, not 4.
This is exactly what you need here:
SET STATISTICS IO, TIME ON;

-- Let's try to enlarge the column again
ALTER TABLE EnlargeTest ALTER COLUMN SomeColumn int;

SET STATISTICS IO, TIME OFF;

/*

 SQL Server Execution Times:
   CPU time = 0 ms,  elapsed time = 0 ms.

 */
Excellent! This time the command completes instantly and the ALTER COLUMN statement is a metadata only change.
The good news is that Row Compression is available in all editions of SQL Server since version 2016 SP1 and compression can be applied by rebuilding indexes ONLINE, with no downtime (yes, you will need Enteprise Edition for this).
The (relatively) bad news is that I tested this method on several versions of SQL Server and it only works on 2016 and above. Previous versions are not smart enough to take the compression options into account when enlarging the columns and they first enlarge and then reduce the columns when executing the ALTER COLUMN command. Another downside to this method is that row compression will refuse to work if the total size of your columns exceeds 8060 bytes, as the documentation states.
Bottom line is: painless column enlargement is possible, if you take the Row Compression pills. Just don’t overdo it: you don’t want to enlarge your columns too much, do you?
Introducing XESmartTarget
Three years ago, I started to work on a project called ExtendedTsqlCollector. I blogged about it multiple times here on spaghettidba.com.
Even if I received positive feedback, I knew that one aspect was slowing down the adoption of the project: the Data Collector. That particular feature of SQL Server has a very bad reputation for being difficult to set up, customize and monitor. ExtendedTSQLCollector tried to address some of those issues, but the damage was already done and I knew that the Data Collector was already on the verge of extinction.
So, how could I preserve the work done for that project and, at the same time, offer DBAs the ability to set up complex actions in response to events? What I aimed to release was a tool capable of streaming events from a session and perform configurable actions in response to those events, mainly writing to a database table and sending alerts. The tool I had in mind should have to be configured in a simple and straightforward way, possibly with a single configuration file.
So, back to the drawing board. The tool I came up with had ditched the data collector, but it kept as much as possible from the previous project.
Introducing XESmartTarget
I am proud to introduce XESmartTarget: the easiest way to interact with extended events sessions without writing a single line of code.
XESmartTarget uses the Extended Events streaming API to connect to a session and execute some actions in response to each event. The actions you perform can be configured in a simple .json file, which controls the Response types and all their properties.
For instance, if you have a session to capture deadlocks, you may want to be notified whenever such an event is captured. All you need to do is configure XESmartTarget to send an email using the EmailResponse class. You can do that by creating a simple .json file with all the parameters needed:
| { | |
| "Target": { | |
| "ServerName": "(local)\\SQL2014", | |
| "SessionName": "deadlocks", | |
| "FailOnProcessingError": false, | |
| "Responses": [ | |
| { | |
| "__type": "EmailResponse", | |
| "SMTPServer": "localhost", | |
| "Sender": "from@test.com", | |
| "To": "dba@localhost.localdomain", | |
| "Subject": "Deadlock occurred", | |
| "Body": "Deadlock occurred at {collection_time}", | |
| "Attachment": "xml_report", | |
| "AttachmentFileName": "deadlock.xdl", | |
| "HTMLFormat": true, | |
| "Events": [ | |
| "xml_deadlock_report" | |
| ] | |
| } | |
| ] | |
| } | |
| } |
XESmartTarget will connect to your session and will execute an EmailResponse for every event you capture. What will you see? Not much, because XESmartTarget is a console application that you are supposed to run in the background:
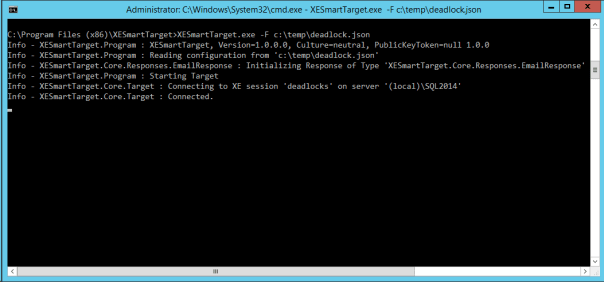
What you will actually see is email messages flowing to your inbox:
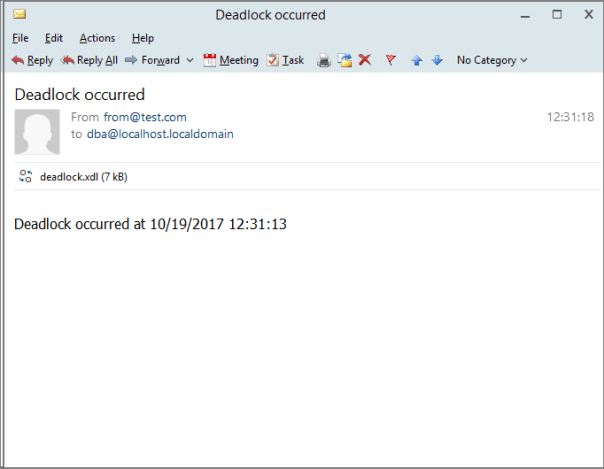
This is just an example of what XESmartTarget can do: you already have Response types to write events to a database table or replay execution-related events to a target instance. More Response types are in the works as well, but the good news is that XESmartTarget is open source, so you can code your own ad contribute it to the project on GitHub.
What are you waiting for? Download and try XESmartTarget now!
Installing SQL Server 2016 Language Reference Help from disk
A couple of years ago I blogged about Installing the SQL Server 2014 Language Reference Help from disk.
With SQL Server 2016 things changed significantly: we have the new Help Viewer 2.2, which is shipped with the Management Studio setup kit.
However, despite all the changes in the way help works and is shipped, I am still unable to download and install help content from the web, so I resorted to using the same trick that I used for SQL Server 2014.
This time the URLs and the files to download are different:
- Point your browser to http://services.mtps.microsoft.com/ServiceAPI/catalogs/sql2016/en-us
- Download the Language Reference Files:
If you’re a PowerShell person, these three lines will do:
Invoke-WebRequest -Uri "http://packages.mtps.microsoft.com/sql_2016_branding_en-us(1bd6e667-f159-ac3b-f0a5-964c04ca5a13).cab" `
	-OutFile "sql_2016_branding_en-us(1bd6e667-f159-ac3b-f0a5-964c04ca5a13).cab"
Invoke-WebRequest -Uri "http://packages.mtps.microsoft.com/v2sql_shared_language_reference_b4621_sql_130_en-us_1(83748a56-8810-751f-d453-00c5accc862d).cab" `
	-OutFile "v2sql_shared_language_reference_b4621_sql_130_en-us_1(83748a56-8810-751f-d453-00c5accc862d).cab"
Invoke-WebRequest -Uri "http://packages.mtps.microsoft.com/v2sql_shared_language_reference_b4621_sql_130_en-us_2(ccc38276-b744-93bd-9008-fe79b294ff41).cab" `
	-OutFile "v2sql_shared_language_reference_b4621_sql_130_en-us_2(ccc38276-b744-93bd-9008-fe79b294ff41).cab"
- Create a text file name HelpContentSetup.msha in the same folder as the .cab files and paste the following html:
<html xmlns="http://www.w3.org/1999/xhtml">
<head />
<body class="vendor-book">
    <div class="details">
        <span class="vendor">Microsoft</span>
        <span class="locale">en-us</span>
        <span class="product">SQL Server 2016</span>
        <span class="name">Microsoft SQL Server Language Reference</span>
    </div>
    <div class="package-list">
        <div class="package">
            <span class="name">SQL_2016_Branding_en-US</span>
            <span class="deployed">False</span>
            <a class="current-link" href="sql_2016_branding_en-us(1bd6e667-f159-ac3b-f0a5-964c04ca5a13).cab">sql_2016_branding_en-us(1bd6e667-f159-ac3b-f0a5-964c04ca5a13).cab</a>
        </div>
        <div class="package">
            <span class="name">v2SQL_Shared_Language_Reference_B4621_SQL_130_en-us_1</span>
            <span class="deployed">False</span>
            <a class="current-link" href="v2sql_shared_language_reference_b4621_sql_130_en-us_1(83748a56-8810-751f-d453-00c5accc862d).cab">v2sql_shared_language_reference_b4621_sql_130_en-us_1(83748a56-8810-751f-d453-00c5accc862d).cab</a>
        </div>
        <div class="package">
            <span class="name">v2SQL_Shared_Language_Reference_B4621_SQL_130_en-us_2</span>
            <span class="deployed">False</span>
            <a class="current-link" href="v2sql_shared_language_reference_b4621_sql_130_en-us_2(ccc38276-b744-93bd-9008-fe79b294ff41).cab">v2sql_shared_language_reference_b4621_sql_130_en-us_2(ccc38276-b744-93bd-9008-fe79b294ff41).cab</a>
        </div>
    </div>
</body>
</html>
- First, set the Help Viewer to open help from the local sources:
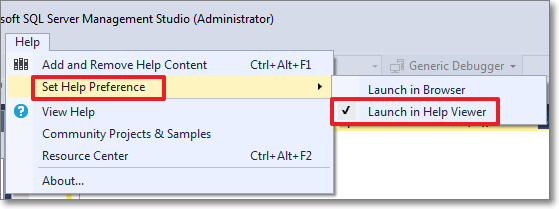
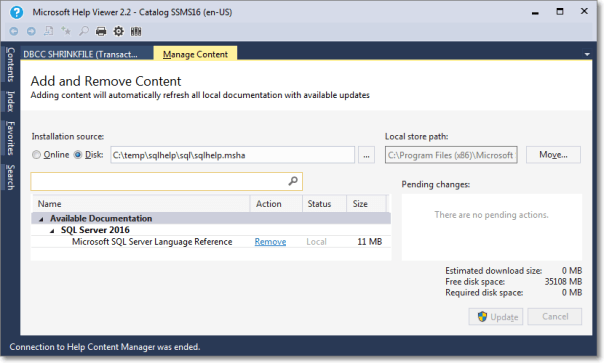
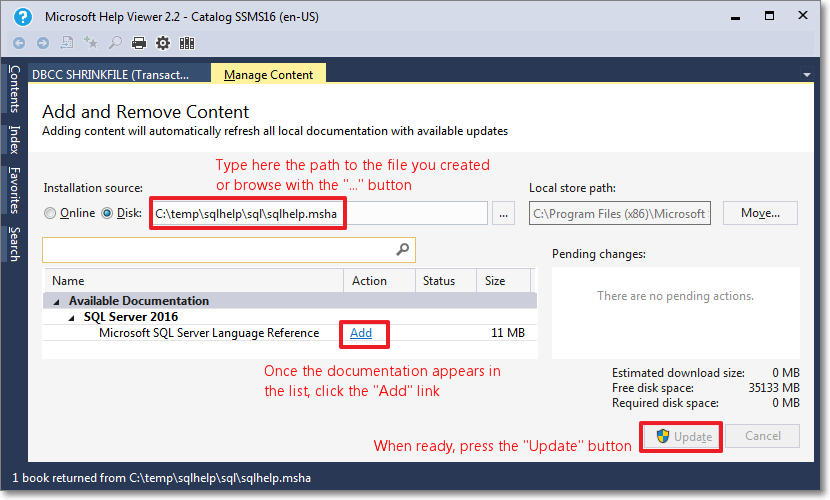
- Then select the “Add and Remove Help Content” command:
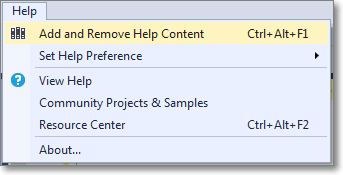
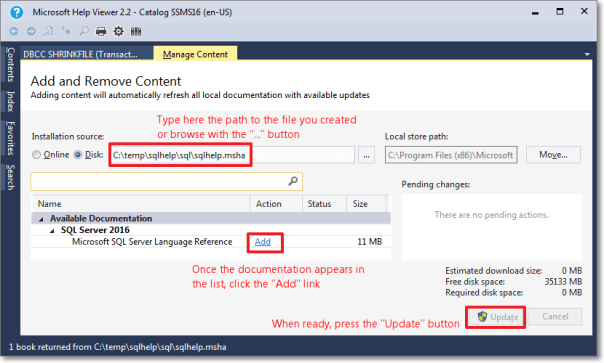
- This command opens the Help Viewer and asks for the content to add.
Browse to the file you created in step 3.
Click “Add” on all the items you wish to add to the library. In this case you will have only 1 item.
When done, click the “Update” button.
- Unfortunately, during the installation phase of the library item, something crashes and the installation won’t proceed until you tell it to ignore or report the error.
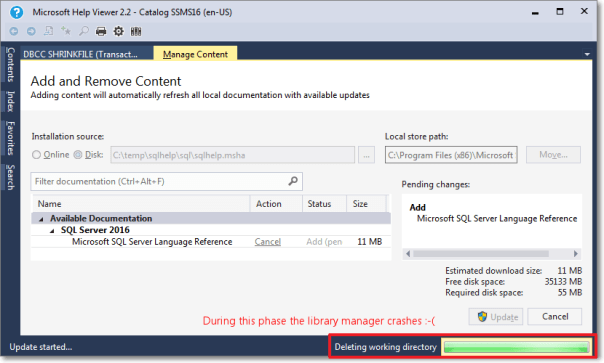
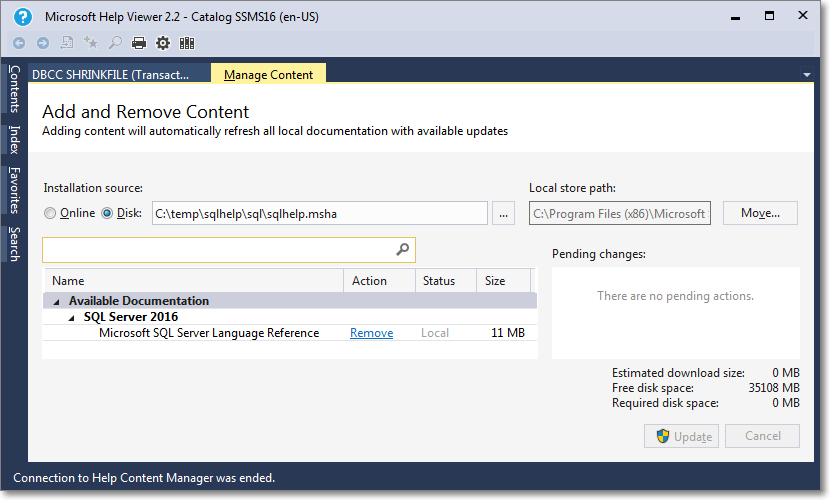
- Despite the crash, everything works as expected and you will find the topic installed in your help library:

Here it is, nice and easy. Hope it works for you too.
SSMS is now High-DPI ready
One of the most popular posts on this bog describes how to enable bitmap scaling is SSMS on high DPI displays, which is a sign that more and more people are starting to use 4K displays and are unhappy with SSMS’s behaviour at high DPI. The solution described in that post is to enable bitmap scaling, which renders graphic objects correctly, at the price of some blurriness.
The good news is that starting with SSMS 16.3 high DPI displays are finally first class citizens and SSMS does its best to scale objects properly. By default, SSMS will keep using bitmap scaling: in order to enable DPI scaling you will have to use a manifest file.
- Merge this key to your registry:
Windows Registry Editor Version 5.00[HKEY_LOCAL_MACHINE\SOFTWARE\Microsoft\Windows\CurrentVersion\SideBySide]
"PreferExternalManifest"=dword:00000001
- Save this manifest file to “C:\Program Files (x86)\Microsoft SQL Server\130\Tools\Binn\ManagementStudio\Ssms.exe.manifest” using UTF-8 format:
<?xml version="1.0" encoding="UTF-8" standalone="yes"?>
<assembly xmlns="urn:schemas-microsoft-com:asm.v1" manifestVersion="1.0" xmlns:asmv3="urn:schemas-microsoft-com:asm.v3">
    <asmv3:application>
        <asmv3:windowsSettings xmlns="http://schemas.microsoft.com/SMI/2005/WindowsSettings">
            <dpiAware>True</dpiAware>
        </asmv3:windowsSettings>
    </asmv3:application>
    <dependency>
        <dependentAssembly>
            <assemblyIdentity type="win32" name="Microsoft.Windows.Common-Controls" version="6.0.0.0" processorArchitecture="X86" publicKeyToken="6595b64144ccf1df" language="*" />
        </dependentAssembly>
    </dependency>
    <dependency>
        <dependentAssembly>
            <assemblyIdentity type="win32" name="debuggerproxy.dll" processorArchitecture="X86" version="1.0.0.0"></assemblyIdentity>
        </dependentAssembly>
    </dependency>
</assembly>
This is a huge improvement over the bitmap scaling solution we had to use up to now: no more blurriness and proper fonts are used in SSMS.
For comparison, this is how bitmap scaling renders in SSMS 2014:

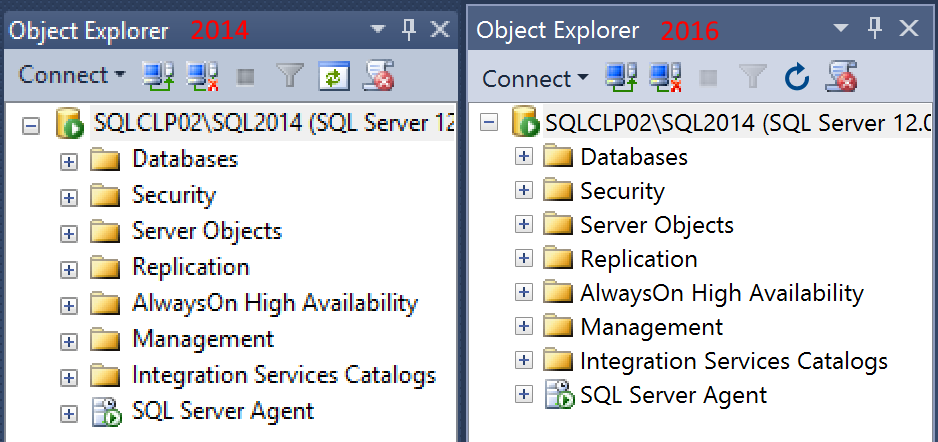
And this is how DPI scaling renders is SSMS 16.3, with scaling set to 200%:

As you can see, it’s not perfect yet (for instance, I had to change the grid font size to 9pt. in order to have readable fonts).
However, the GUI is much more readable now. For instance, look at the difference in object explorer: (click on the image to open fullsize and see the difference)
Now that your favourite tool is working in high DPI displays, nothing is holding you back from buying one of those fancy 4K laptops!
Upcoming Speaking Engagements
The next few months will be crazy for me. I will be travelling a lot around Europe, speaking about SQL Server topics.
Here is where you will find me in the upcoming weeks:
- May 4: SQLNexus
SQLNexus is a new conference in Copenhagen and will be the official launch event in Denmark for SQL Server 2016.
I will speak about “Responding to Extended Events in near Real-Time”.
- May 5: SQLBits
SQLBits doesn’t need to be introduced. It’s the biggest SQL Server event in Europe and it will also be the official SQL Server 2016 launch event in UK.
Again, I will speak about “Responding to Extended Events in near Real-Time”.
- May 16: NTK
NTK is a famous conference in Slovenia, which has been running for many years now. This year it will be held in Portorosz, near the Italian border.
It’s going to be fun: I will speak about “Benchmarking, Baselining and Workload Analysis”.
- June 14: INSIDE-SQL
INSIDE-SQL is also a new event, run this year for the first time. It’s an event focused on in-depth concepts, delivered in 75 minutes sessions, with long breaks between sessions, so that attendees can go to the next session without rushing and can hang out with the speakers and ask questions.
I will deliver two sessions:
“Responding to Extended Events in near Real-Time”
“Advanced T-SQL Techniques”
- June 24: SQL Saturday Paris
Free SQL Server training from the 40th floor of the Tour Montparnasse in Paris.What else can I say?
I will be speaking about “New Security Features in SQL Server 2016”
- September 10: SQL Saturday Cambridge
One of the coolest SQLSats around!
This time I’ll be speaking about “SQL Server Infernals”, AKA “how to torture your SQL Server instances to death with worst practices”. It’s going to be fun!
I hope to see you at these super cool events!
Weird Things Happen with Windows Users
This will be no surprise to those who have been working with SQL Server for a long time, but it can be puzzling at first and actually I was a bit confused myself when I stumbled upon this behavior for the first time.
SQL Server treats windows users in a special way, a way that could lead us to some interesting observations.
First of all, we need a test database and a couple of windows principals to perform our tests:
1. In a command prompt, create a windows group named ‘testGroup’
net localgroup testGroup /ADD
2. In a command prompt, create a windows user named ‘testUser’ and add it to the group
net user testUser "testUser" /ADD

net localgroup testGroup testUser /ADD
3. In SSMS, create a test database:
CREATE DATABASE testWindowsUser;
Now that everything is set up, we can start our investigation.
You can create a database user for a Windows user with no corresponding login
When dealing with windows users, you don’t need to create a login in SQL Server in order to create a database user, but you can create it directly:
USE testWindowsUser;
GO

CREATE USER [XPS13-SQLC\testUser];
GO
We just created a user in the database, without creating a login first and without having to add “WITHOUT LOGIN” to the CREATE USER statement. If you search for a login with the same SID in sys.logins, nothing will turn up:
SELECT svp.name AS login_name,
	dbp.name AS user_name,
	dbp.default_schema_name
FROM sys.database_principals AS dbp
LEFT JOIN sys.server_principals AS svp
	ON dbp.sid = svp.sid
WHERE dbp.name LIKE '%testUser';
login_name  user_name            default_schema_name
----------- -------------------- --------------------
NULL        XPS13-SQLC\testUser  dbo
It is interesting to note that the default schema for the user, if you don’t specify one, will be “dbo”.
At this point, the Windows user cannot log in to SQL Server, but the user can be impersonated to perform operations against the databases, in the same exact way as with any other user without login.
Before we proceed with the investigation, let’s clean up our mess:
DROP USER [XPS13-SQLC\testUser];
You can create a database user for a Windows group with no corresponding login
If we try to do the same thing with a Windows group, we get even more interesting findings.
USE testWindowsUser;
GO

CREATE USER [XPS13-SQLC\testGroup]
GO
Again, we did not have to specify an existing login name and we did not have to add “WITHOUT LOGIN”. Looking at the user data in sys.database_principals and sys.logins shows again that no login is associated with this user, but this time we can see that no default schema was set.
SELECT svp.name AS login_name,
	dbp.name AS user_name,
	dbp.default_schema_name
FROM sys.database_principals AS dbp
LEFT JOIN sys.server_principals AS svp
	ON dbp.sid = svp.sid
WHERE dbp.name LIKE '%testGroup';
login_name  user_name             default_schema_name
----------- --------------------- --------------------
NULL        XPS13-SQLC\testGroup  NULL
As common sense suggests, we cannot impersonate a database user that corresponds to a Windows group. If we try that, we are met with an error message.
EXECUTE AS USER = 'XPS13-SQLC\testGroup'; -- '
Msg 15517, Level 16, State 1, Line 85
Cannot execute as the database principal because the principal "XPS13-SQLC\testGroup" does not exist,
this type of principal cannot be impersonated, or you do not have permission.
Windows users are granted access through groups in surprising ways
Now the fun begins. Turns out that you can impersonate a Windows user that is not a user in the database, as long as the Windows user is a member of the group.
Let’s grant some permissions to the group and see what happens:
ALTER ROLE db_owner ADD MEMBER [XPS13-SQLC\testGroup];
GO

EXECUTE AS USER = 'XPS13-SQLC\testUser'; -- '
EXEC('CREATE VIEW testView AS SELECT 1 AS one');
REVERT;
GO
Surprisingly enough, we were able to impersonate a database principal that doesn’t exist at all. In fact we dropped it right before we started to play with the groups, right? Let’s check again the database principals:
SELECT svp.name AS login_name,
	dbp.name AS user_name,
	dbp.default_schema_name
FROM sys.database_principals AS dbp
LEFT JOIN sys.server_principals AS svp
	ON dbp.sid = svp.sid
WHERE dbp.name LIKE '%test%';
GO
login_name  user_name             default_schema_name
----------- --------------------- --------------------
NULL        XPS13-SQLC\testGroup  NULL
NULL        XPS13-SQLC\testUser   XPS13-SQLC\testUser
Wait, what? Who created that user? Looks like SQL Server creates the database user automatically when it needs to impersonate one of the group members that are not created in the database yet.
Another interesting fact is that the default schema of the newly created user matches the user name. If we don’t like that, we can change it afterwards, but wouldn’t it be cool if we could simply change that on the Windows group and let it propagate to the users created during this process? Let’s try and see if this is possible.
-- First let's drop the user and dependent objects
DROP VIEW [XPS13-SQLC\testUser].testView;
DROP SCHEMA [XPS13-SQLC\testUser];
DROP USER [XPS13-SQLC\testUser];
GO

-- Then let's change the default schema for the group
ALTER USER [XPS13-SQLC\testGroup] WITH default_schema = dbo;
GO

-- Let's re-create the view impersonating the user
EXECUTE AS USER = 'XPS13-SQLC\testUser'; -- '
EXEC('CREATE VIEW testView AS SELECT 1 AS One');
REVERT
GO

-- Check if the view is there
SELECT OBJECT_SCHEMA_NAME(object_id) AS schema_name, name
FROM sys.views
WHERE name = 'testView';
GO

-- Check database users:
SELECT svp.name AS login_name,
	dbp.name AS user_name,
	dbp.default_schema_name
FROM sys.database_principals AS dbp
LEFT JOIN sys.server_principals AS svp
	ON dbp.sid = svp.sid
WHERE dbp.name LIKE '%test%';
GO
schema_name  name
------------ ---------
dbo          testView

login_name   user_name             default_schema_name
------------ --------------------- --------------------
NULL         XPS13-SQLC\testGroup  dbo
This time the view was placed in the “dbo” schema as expected (remember? We set the default schema on the group), but the really weird thing is that no new user was added. Why? I couldn’t find any answer in the documentation. It is even more puzzling that SQL Server was able to impersonate a user that is not present at all. Nevertheless, as far as I can remember it has always been like this, at least starting from SQL Server 2005.
To be sure we’re not imagining things, let’s change again the default schema of the Windows group:
-- Note the weird syntax
ALTER USER [XPS13-SQLC\testGroup] WITH default_schema = NULL;
GO

-- Let's re-create the view impersonating the user
EXECUTE AS USER = 'XPS13-SQLC\testUser'; -- '
EXEC('CREATE VIEW testView AS SELECT 1 AS One');
REVERT
GO

-- Check if the view is there
SELECT OBJECT_SCHEMA_NAME(object_id) AS schema_name, name
FROM sys.views
WHERE name = 'testView';
GO

-- Check database users:
SELECT svp.name AS login_name,
	dbp.name AS user_name,
	dbp.default_schema_name
FROM sys.database_principals AS dbp
LEFT JOIN sys.server_principals AS svp
	ON dbp.sid = svp.sid
WHERE dbp.name LIKE '%test%';
GO
schema_name          name
-------------------- ---------------------
dbo                  testView
XPS13-SQLC\testUser  testView

login_name           user_name             default_schema_name
-------------------- --------------------- --------------------
NULL                 XPS13-SQLC\testGroup  NULL
NULL                 XPS13-SQLC\testUser   XPS13-SQLC\testUser
Again, SQL Server creates a new user and assigns it a default schema with the same name. The view was placed in the user’s default schema.
Now let’s revert to a clean database and drop some objects.
DROP VIEW dbo.testView;
DROP VIEW [XPS13-SQLC\testUser].testView;
DROP SCHEMA [XPS13-SQLC\testUser];
DROP USER [XPS13-SQLC\testUser];
GO
In order to have a complete picture, we can now check what happens if we create a login for the windows user.
CREATE LOGIN [XPS13-SQLC\testUser] FROM WINDOWS;
GO

EXECUTE AS LOGIN = 'XPS13-SQLC\testUser';
EXEC('CREATE VIEW testView AS SELECT 1 AS One');
REVERT
GO

-- Check if the view is there
SELECT OBJECT_SCHEMA_NAME(object_id) AS schema_name, name
FROM sys.views
WHERE name = 'testView';
GO

-- Check database users:
SELECT svp.name AS login_name,
	dbp.name AS user_name,
	dbp.default_schema_name
FROM sys.database_principals AS dbp
LEFT JOIN sys.server_principals AS svp
	ON dbp.sid = svp.sid
WHERE dbp.name LIKE '%test%';
GO
schema_name          name
-------------------- ---------------------
XPS13-SQLC\testUser  testView


login_name           user_name             default_schema_name
-------------------- --------------------- --------------------
NULL                 XPS13-SQLC\testGroup  NULL
XPS13-SQLC\testUser  XPS13-SQLC\testUser   XPS13-SQLC\testUser
Again, SQL Server creates a new database user for this login and a schema with the same name. The view gets added to the user’s default schema.
What is interesting to note is that we could access the database by logging in as the Windows user, without having an explicit permission path to allow it. Only after accessing the database an explicit database user is created.
If we try the same thing with the default schema set to “dbo” on the windows group, the behavior matches what we got for the user:
-- let's try again with a default schema on the group
ALTER USER [XPS13-SQLC\testGroup] WITH default_schema = dbo;
GO

-- cleanup
DROP VIEW dbo.testView;
DROP VIEW [XPS13-SQLC\testUser].testView;
DROP SCHEMA [XPS13-SQLC\testUser];
DROP USER [XPS13-SQLC\testUser];
GO

EXECUTE AS LOGIN = 'XPS13-SQLC\testUser'; -- '
EXEC('CREATE VIEW testView AS SELECT 1 AS One');
REVERT
GO

-- Check if the view is there
SELECT OBJECT_SCHEMA_NAME(object_id) AS schema_name, name
FROM sys.views
WHERE name = 'testView';
GO

-- Check database users:
SELECT svp.name AS login_name,
	dbp.name AS user_name,
	dbp.default_schema_name
FROM sys.database_principals AS dbp
LEFT JOIN sys.server_principals AS svp
	ON dbp.sid = svp.sid
WHERE dbp.name LIKE '%test%';
GO
This means that this behavior has to be taken into account when we’re querying permissions on the databases to see who can access what. In order to know whether a windows user is member of a windows group, we can use the system function IS_MEMBER().
In our case, it would be enough to call the function in this way:
EXECUTE AS LOGIN = 'XPS13-SQLC\testUser'; -- '
SELECT IS_MEMBER('XPS13-SQLC\testGroup');
REVERT
GO
Unfortunately, there is no additional parameter available to specify which windows user to test for group membership and the function will always test against the current login. This has two important consequences:
- To test multiple logins, we need to impersonate them one at a time, which is difficult to achieve in scripts.
- There is no way to test database users: impersonating the database user will not be enough to test the windows group membership for the windows user associated to the database user.
Summing it up, this is what we have:
| Windows user impersonated as | Group’s Default Schema set | New user added | New user’s schema |
|---|---|---|---|
| Database User | No | Yes | User name |
| Database User | Yes | No | – |
| Login | No | Yes | User name |
| Login | Yes | No | – |
The dbo user can be mapped to a non-existing Windows User
This is extremely tricky and I was bitten by this behavior recently, wasting countless hours trying to figure out what was happening.
Imagine that a developer creates a database in the development environment, while logged in with Windows authentication. This is a very common scenario, both if you’re using a centralized development server or developers’ workstations.
When development is complete, the developer hands us a database backup to restore in production, because the database already contains some data (built-in values in lookup tables or something else required by the application). We restore the database in production, where the developer does not have a login, confident that he will be unable to access it. Well, that’s not exactly what is going to happen.
Let’s see it with an example:
-- Grant dbcreator permissions to the windows user
ALTER SERVER ROLE dbcreator ADD MEMBER [XPS13-SQLC\testUser]
GO

-- The user creates a database. It may happen in development, right?
EXECUTE AS LOGIN = 'XPS13-SQLC\testUser';
CREATE DATABASE testWindowsGroup
REVERT
GO

-- Let's pretend that developers finish working with the database
-- and ask to move it from development to production
-- He takes a backup and we restore it to production
BACKUP DATABASE testWindowsGroup TO DISK = 'c:\temp\testWindowsGroup.bak';
GO

-- We don't have two separate servers to test, we will simulate
-- the same situation by dropping some objects. Let's drop the database.
DROP DATABASE testWindowsGroup;
GO

-- Now let's drop the associated windows login
DROP LOGIN [XPS13-SQLC\testUser]
GO

-- The database gets restored in production (again, we will use the same instance,
-- but the main point is that the login of the database owner is not present).
RESTORE DATABASE testWindowsGroup FROM DISK = 'c:\temp\testWindowsGroup.bak'
GO

-- Who's the owner of the database? You, the DBA. Looking good.
SELECT db.name, svp.name
FROM sys.databases AS db
INNER JOIN sys.server_principals AS svp
	ON db.owner_sid = svp.sid
WHERE database_id = DB_ID('testWindowsGroup');
Everything is set up the way it should: the database is restored to production, the DBA is the database owner, the developer has no access to the database and everybody is happy.
Now imagine that a new totally unrelated database gets added to the production instance, a database where everybody in the company must have read-only access. We create a new login for a Windows group that includes all authorized logins and we grant access to the new database.
Again, let’s see it with an example (using tempdb):
-- Let's add a login for the group and grant permissions on another database
-- I will use tempdb here, but it could be any other database.
CREATE LOGIN [XPS13-SQLC\testGroup] FROM WINDOWS;
GO

USE tempdb;
GO

-- The group gets added to tempdb with read-only permissions
CREATE USER [XPS13-SQLC\testGroup] FOR LOGIN [XPS13-SQLC\testGroup];
ALTER ROLE db_datareader ADD MEMBER [XPS13-SQLC\testGroup];
GO

-- Let’s go back to the database we restored previously
USE testWindowsGroup;
GO

-- Now see what happens:
EXECUTE AS LOGIN = 'XPS13-SQLC\testUser'; -- '
EXEC('CREATE VIEW testView AS SELECT 1 AS One');
REVERT
GO
WTF? A windows user that has no matching SQL Server login could create a view in a database where no matching user exists? How could that happen?
-- Let's check the permissions of this user:
EXECUTE AS LOGIN = 'XPS13-SQLC\testUser'; -- '
SELECT IS_ROLEMEMBER('db_owner') AS IAmDbOwner,
	IS_MEMBER('db_owner') AS AgainDbOwner;
REVERT
GO
IAmDbOwner	AgainDbOwner
----------- -------------
          1             1
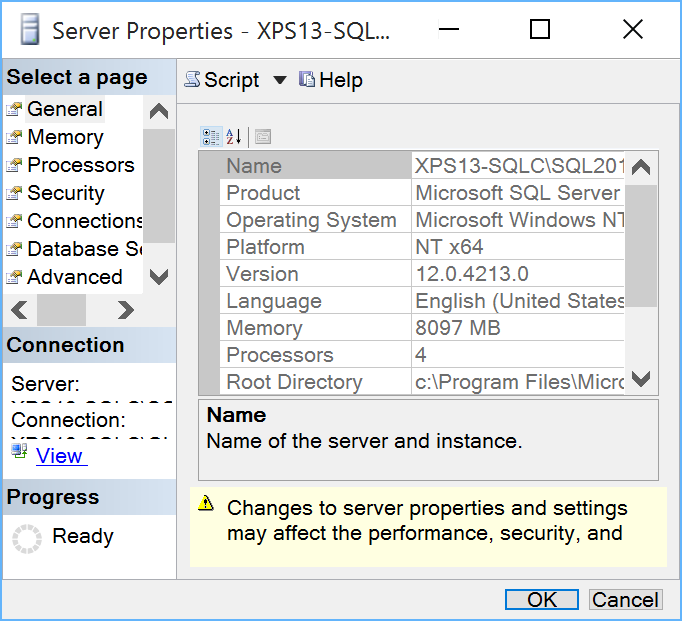
Weird. The login of the Windows user seems to be the database owner, but we checked upon restore that the DBA is the database owner. Moreover, there is no explicit login in the server for this Windows user and the only Windows group that contains this user does not have access at all to the database: how is this possible?
The answer is buried inside the database principals table:
-- The sid of the dbo user is still the sid of the user that created the database,
-- even if the windows user is not a login in SQL Server
SELECT sid
FROM sys.database_principals
WHERE name = 'dbo';
We got access to the database thanks to a windows group added to grant access to a totally unrelated database. The group has no permissions whatsoever on the database, but it allows its members to log in: the actual permissions on the database are granted through the SID of the dbo user.
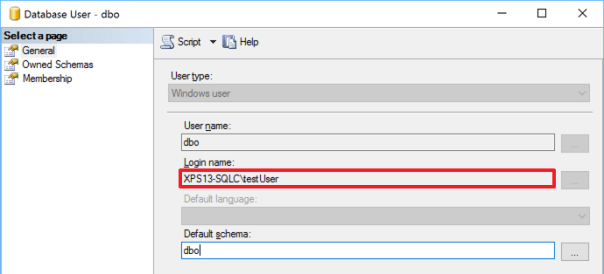
This can be spotted immediately with the GUI, which is a fact that hides the resolution even more from experienced DBAs that don’t use the GUI at all.
Bottom line
Windows authentication comes handy most of the times and it offers better protection compared to SQL Server authentication, but sometimes the way SQL Server treats Windows users can be puzzling.
Don’t take things for granted and check now if you really understand who has access to your databases: the answer might be very different from what you expect.
P.S. If you’re wondering why I placed a comment with a quote after every “EXECUTE AS” statement, it’s just to fix this WordPress wacky syntax highlighter going nuts.
An annoying Bug in the Restore Dialog
Today, thanks to a customer, I discovered one of those annoying little things that can really drive you nuts.
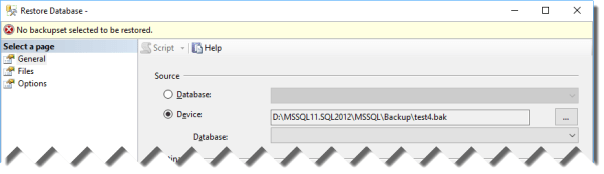
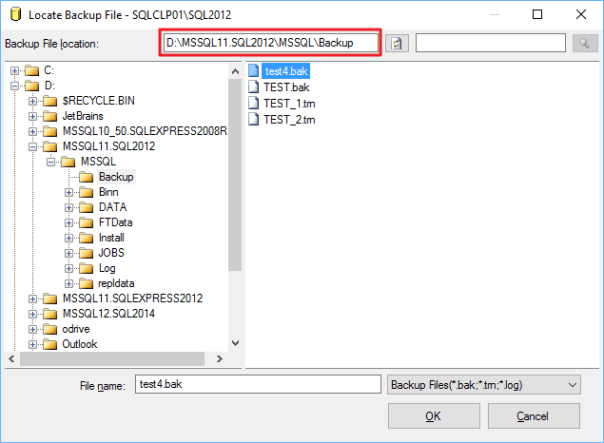
Basically, they were trying to restore a backup using the SSMS Restore Database window and they kept getting “No backupset selected to be restored” whenever a backup file was selected.
You just had to select a file for restore and click OK…
… to be met with an error message in the Restore Database window:
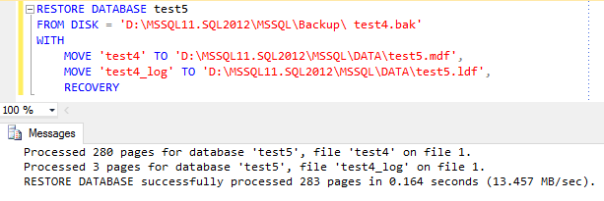
The weird thing about it is that the backup file restored perfectly fine from a T-SQL script:
So it had to be something wrong with SSMS, but what?
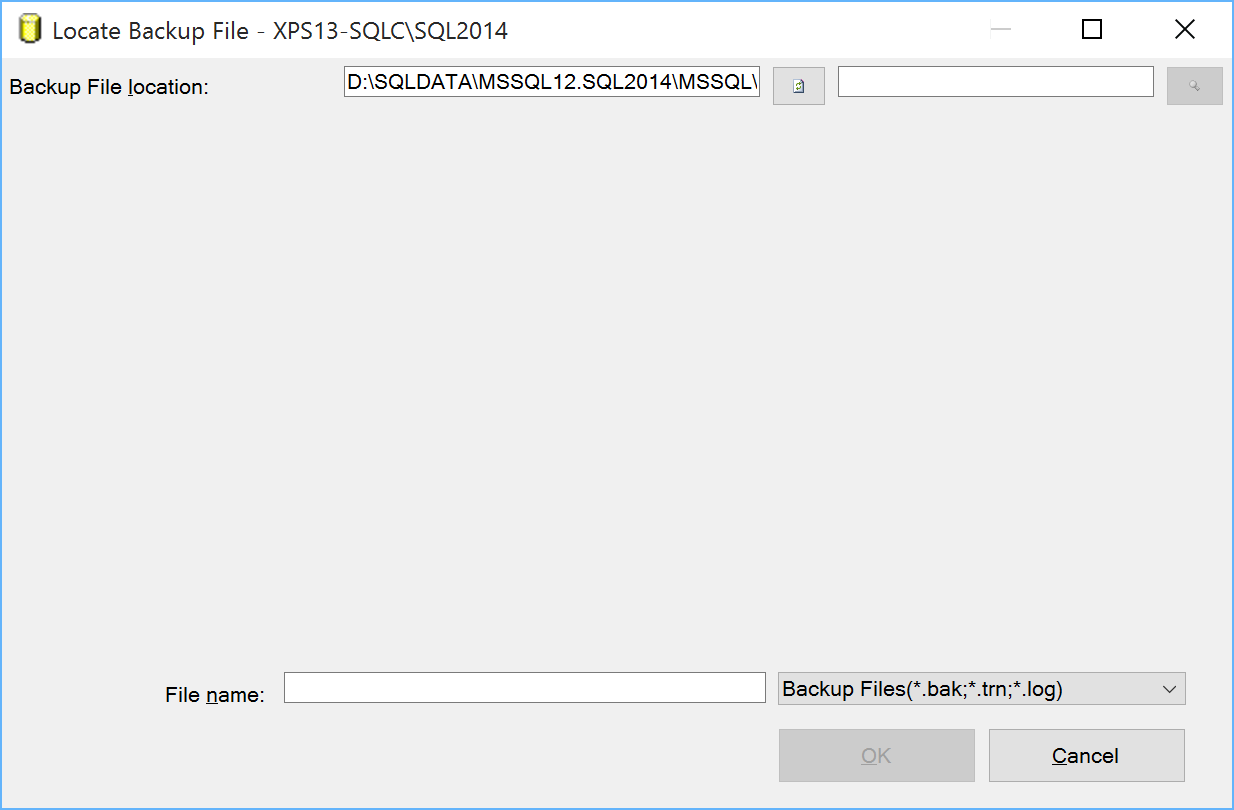
Looking closer at the restore script, one thing stands out. Look at the file name:
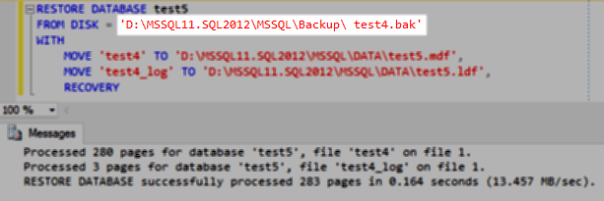
Yep, there’s a leading whitespace in the file name. Could that be the source of the problem?
Let’s try again with the GUI in a slightly different way. This time I will copy the folder path from the “Backup File Location” textbox…
… and paste it directly in the “File name” textbox, right before the file name:
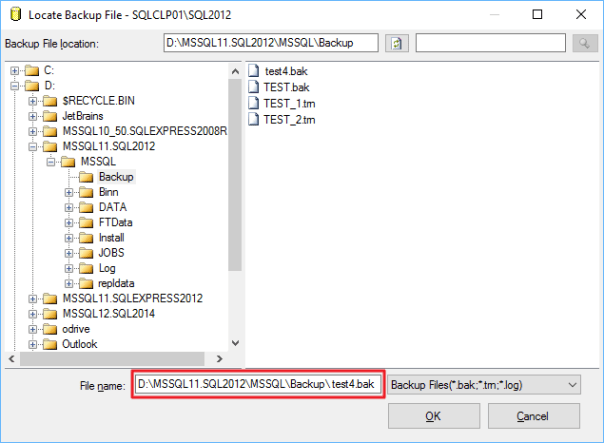
This time everything works as expected.
Bottom line:
- This is a bug in SSMS: go on and vote this Connect item to have it fixed in a future version.
- Don’t use the GUI to restore a database.
- Don’t use the GUI at all.
SSMS in High-DPI Displays: How to Stop the Madness
I spent the last few weeks travelling a lot compared to my usual routine and I got quickly fed up with bringing my mobile workstation with me. My Dell precision M4600 is a powerhouse, but it’s definitely too big and too heavy for travelling, so I decided it was time to buy a small laptop just for travelling and presenting at SQL Saturdays and events around Europe.
After lots of research, I pulled the trigger on a new XPS13. It’s a very nice, tiny and light machine, beefy enough to run my virtual machines and slim enough to fit in a small bag.
So, everything fine? Not quite. The XPS13 2015 sports a stunning QHD touch display, with almost no bezel: a small wonder. The only complaint with it is windows and its (in)ability to scale applications when running at High DPI.
Windows got better at scaling applications on HiDPI displays and Windows 10 is doing a remarkably good job at scaling applications that can actually scale. I am running at maximum resolution (3200 x 1800) with 200% scale factor and, for instance, Visual Studio 2015 renders perfectly:

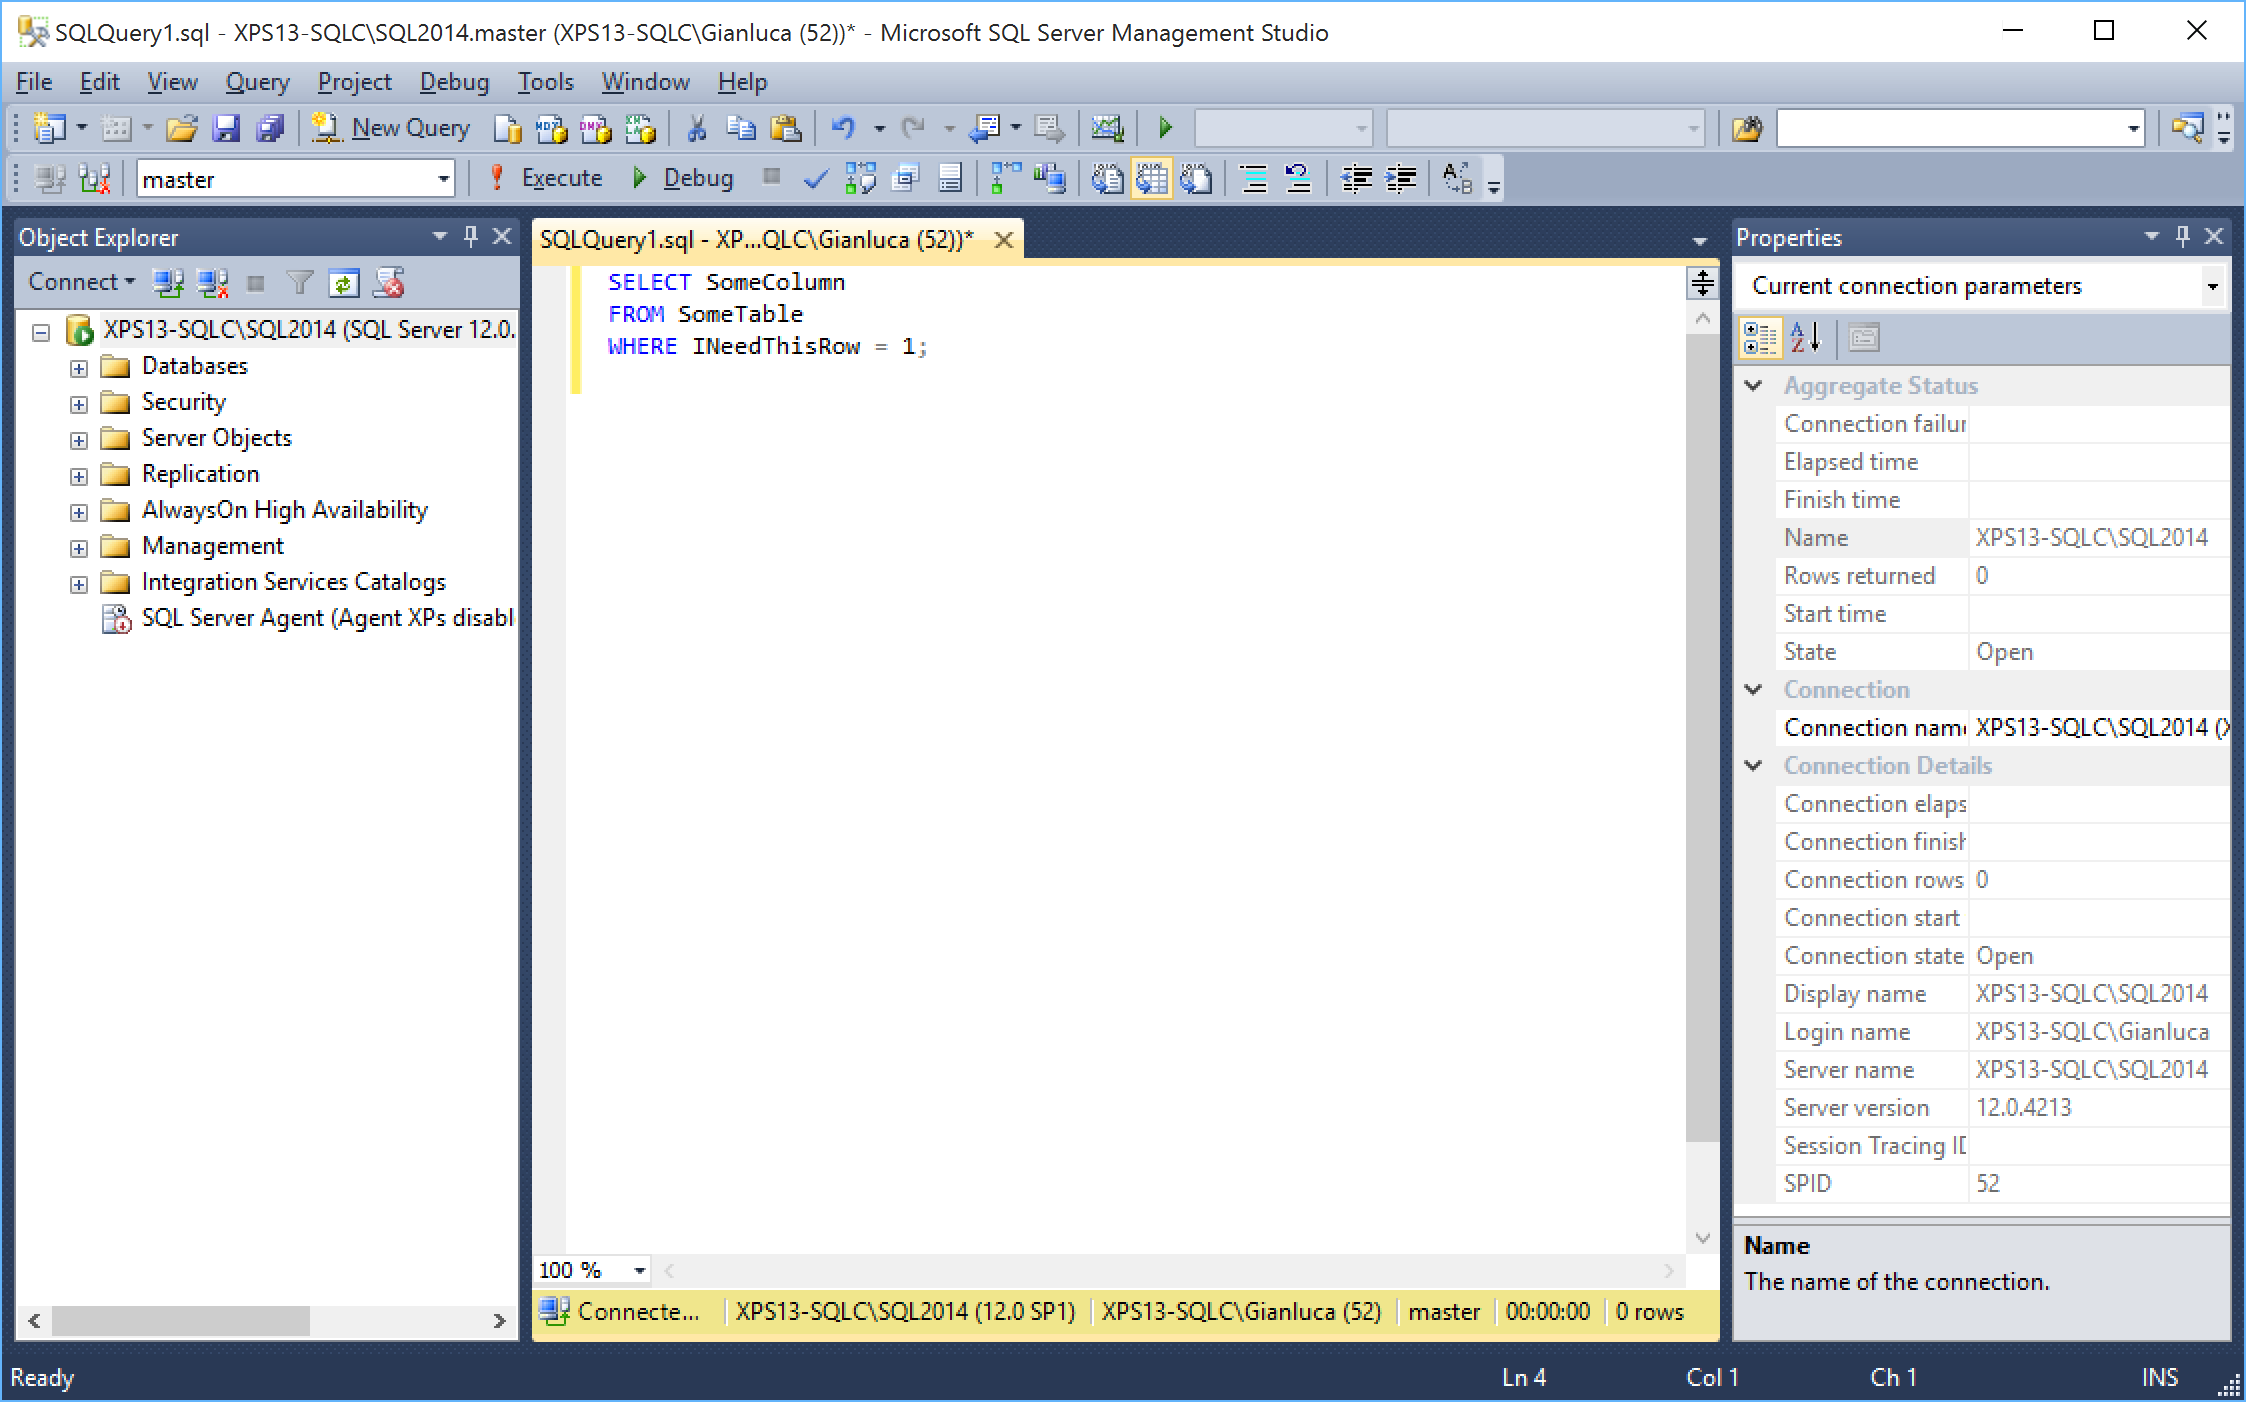
Other applications scale horribly. For instance, SSMS (SQL Server Management Studio) 2014 is a complete disaster:
At a first glance, it looks ok, but look at those icons on the Object Explorer tree: aren’t they a little bit too small compared to the labels next to them?
I can live with small icons, but you just need to open some dialog windows to understand how bad things really are:
As you can see, text gets scaled correctly, but the size of the window and some controls are completely wrong.
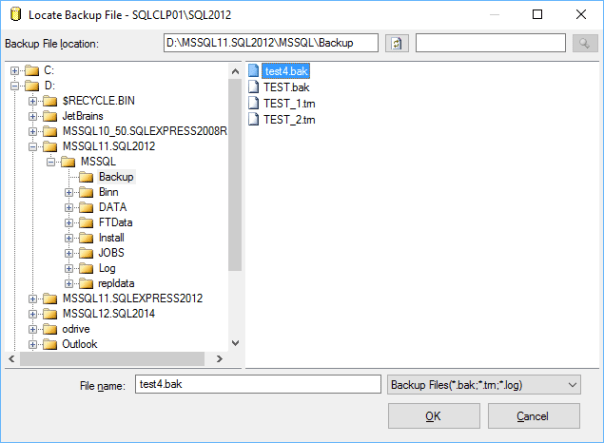
While some dialog windows are easily fixed by resizing them, some other are completely unusable. For instance, the restore database dialog, when locating a backup file, looks like this:
I’m not the first one to discover this kind of issues: Scott Hanselman posted his impressions quite a long time ago, but he offered no solution.
There’s also a Connect item that describes this issue, but… ok, you know what I’m about to say.
A new hope from an old technique
In Windows Vista, you had two possible ways of scaling applications: with the first one (the default) applications were instructed to scale their objects using the scaling factor imposed by the operating system. The results, depending on the quality of the application and the Windows version, could vary a lot. Some scaled correctly, some other look very similar to what we are seeing in SSMS, with some weird-looking GUIs. In Vista, this option was called “XP style DPI scaling”.
The second option, which you could activate by unchecking the “XP style” checkbox, involved drawing the graphical components of the GUI to an off-screen buffer and then drawing them back to the display, scaling the whole thing up to the screen resolution. This option is called “bitmap scaling” and the result is a perfectly laid out GUI:
In order to enable this option in Windows 10, you need to merge this key to your registry:
Windows Registry Editor Version 5.00

[HKEY_LOCAL_MACHINE\SOFTWARE\Microsoft\Windows\CurrentVersion\SideBySide]
"PreferExternalManifest"=dword:00000001
Then, the application has to be decorated with a manifest file that instructs Windows to disable DPI scaling and enable bitmap scaling, by declaring the application as DPI unaware. The manifest file has to be saved in the same folder as the executable (ssms.exe) and its name must be ssms.exe.manifest. In this case, for SSMS 2014, the file path is “C:\Program Files (x86)\Microsoft SQL Server\120\Tools\Binn\ManagementStudio\Ssms.exe.manifest”.
Paste this text inside the manifest file and save it in UTF8 encoding:
<?xml version="1.0" encoding="UTF-8" standalone="yes"?>

<assembly xmlns="urn:schemas-microsoft-com:asm.v1" manifestVersion="1.0" xmlns:asmv3="urn:schemas-microsoft-com:asm.v3">

<dependency>
  <dependentAssembly>
    <assemblyIdentity type="win32" name="Microsoft.Windows.Common-Controls" version="6.0.0.0" processorArchitecture="*" publicKeyToken="6595b64144ccf1df" language="*">
    </assemblyIdentity>
  </dependentAssembly>
</dependency>

<dependency>
  <dependentAssembly>
    <assemblyIdentity type="win32" name="Microsoft.VC90.CRT" version="9.0.21022.8" processorArchitecture="amd64" publicKeyToken="1fc8b3b9a1e18e3b">
    </assemblyIdentity>
  </dependentAssembly>
</dependency>

<trustInfo xmlns="urn:schemas-microsoft-com:asm.v3">
  <security>
    <requestedPrivileges>
      <requestedExecutionLevel level="asInvoker" uiAccess="false"/>
    </requestedPrivileges>
  </security>
</trustInfo>

<asmv3:application>
  <asmv3:windowsSettings xmlns="http://schemas.microsoft.com/SMI/2005/WindowsSettings">
    <ms_windowsSettings:dpiAware xmlns:ms_windowsSettings="http://schemas.microsoft.com/SMI/2005/WindowsSettings">false</ms_windowsSettings:dpiAware>
  </asmv3:windowsSettings>
</asmv3:application>

</assembly>
This “Vista style” bitmap scaling is very similar to what Apple is doing on his Retina displays, except that Apple uses a different font rendering algorithm that looks better when scaled up. If you use this technique in Windows, ClearType rendering is performed on the off-screen buffer before upscaling, so the final result might look a bit blurry.
The amount of blurriness you will see depends on the scale factor you set in the control panel or in the settings app in Windows 10. Needless to say that exact pixel scaling looks better, so prefer 200% over 225% or 250% scale factors, because there is no such thing as “half pixel”.
Seeing is believing:

Bitmap scaling at 200%

Bitmap scaling at 225%

Bitmap scaling at 250%
That’s it: nice and easy. Enjoy your High DPI lifestyle, until Microsoft comes up with a better solution (or a better SSMS).
