Blog Archives
How To Enlarge Your Columns With No Downtime
Let’s face it: column enlargement is a very sensitive topic. I get thousands of emails every month on this particular topic, although most of them end up in my spam folder. Go figure…
The inconvenient truth is that enlarging a fixed size column is a long and painful operation, that will make you wish there was a magic lotion or pill to use on your column to enlarge it on the spot.

Unfortunately, there is no such magic pill, but turns out you can use some SQL Server features to make the column enlargement less painful for your users.
First, let’s create a table with one smallint column, that we will try to enlarge later.
-- Go to a safe place
USE tempdb;
GO

IF OBJECT_ID('EnlargeTest') IS NOT NULL
    DROP TABLE EnlargeTest;

-- Create test table
CREATE TABLE EnlargeTest (
    SomeColumn smallint
);

-- Insert 1 million rows
INSERT INTO EnlargeTest (SomeColumn)
SELECT TOP(1000000) 1
FROM master.dbo.spt_values AS A
CROSS JOIN master.dbo.spt_values AS B;
If you try to enlarge this column with a straight “ALTER TABLE” command, you will have to wait for SQLServer to go through all the rows and write the new data type. Smallint is a data type that is stored in 2 bytes, while int requires 4 bytes, so SQL Server will have to enlarge each and every row to accommodate 2 extra bytes.
This operation requires some time and also causes a lot of page splits, especially if the pages are completely full.
SET STATISTICS IO, TIME ON;

-- Enlarge column
ALTER TABLE EnlargeTest ALTER COLUMN SomeColumn int;

SET STATISTICS IO, TIME OFF;

/*

(1000000 rows affected)
SQL Server parse and compile time:
   CPU time = 0 ms, elapsed time = 0 ms.
Table 'EnlargeTest'. Scan count 9, logical reads 3001171, physical reads 0, read-ahead reads 0, lob logical reads 0, lob physical reads 0, lob read-ahead reads 0.
Table 'Worktable'. Scan count 8, logical reads 2064041, physical reads 0, read-ahead reads 0, lob logical reads 0, lob physical reads 0, lob read-ahead reads 0.

 SQL Server Execution Times:
   CPU time = 13094 ms,  elapsed time = 11012 ms.

 */
The worst part of this approach is that, while the ALTER TABLE statement is running, nobody can access the table.
To overcome this inconvenience, there is a magic column enlargement pill that your table can take, and it’s called Row Compression.

Row compression pills. They used to be expensive, SQL Server 2016 SP1 made them cheap.
Let’s try and revert to the original column size and take the Row Compression pill:
-- Let's revert to smallint
ALTER TABLE EnlargeTest ALTER COLUMN SomeColumn smallint;

-- Add row compression
ALTER TABLE EnlargeTest REBUILD WITH (DATA_COMPRESSION = ROW);
With Row Compression, your fixed size columns can use only the space needed by the smallest data type where the actual data fits. This means that for an int column that contains only smallint data, the actual space usage inside the row is 1 or 2 bytes, not 4.
This is exactly what you need here:
SET STATISTICS IO, TIME ON;

-- Let's try to enlarge the column again
ALTER TABLE EnlargeTest ALTER COLUMN SomeColumn int;

SET STATISTICS IO, TIME OFF;

/*

 SQL Server Execution Times:
   CPU time = 0 ms,  elapsed time = 0 ms.

 */
Excellent! This time the command completes instantly and the ALTER COLUMN statement is a metadata only change.
The good news is that Row Compression is available in all editions of SQL Server since version 2016 SP1 and compression can be applied by rebuilding indexes ONLINE, with no downtime (yes, you will need Enteprise Edition for this).
The (relatively) bad news is that I tested this method on several versions of SQL Server and it only works on 2016 and above. Previous versions are not smart enough to take the compression options into account when enlarging the columns and they first enlarge and then reduce the columns when executing the ALTER COLUMN command. Another downside to this method is that row compression will refuse to work if the total size of your columns exceeds 8060 bytes, as the documentation states.
Bottom line is: painless column enlargement is possible, if you take the Row Compression pills. Just don’t overdo it: you don’t want to enlarge your columns too much, do you?
Installing SQL Server 2016 Language Reference Help from disk
A couple of years ago I blogged about Installing the SQL Server 2014 Language Reference Help from disk.
With SQL Server 2016 things changed significantly: we have the new Help Viewer 2.2, which is shipped with the Management Studio setup kit.
However, despite all the changes in the way help works and is shipped, I am still unable to download and install help content from the web, so I resorted to using the same trick that I used for SQL Server 2014.
This time the URLs and the files to download are different:
- Point your browser to http://services.mtps.microsoft.com/ServiceAPI/catalogs/sql2016/en-us
- Download the Language Reference Files:
If you’re a PowerShell person, these three lines will do:
Invoke-WebRequest -Uri "http://packages.mtps.microsoft.com/sql_2016_branding_en-us(1bd6e667-f159-ac3b-f0a5-964c04ca5a13).cab" `
	-OutFile "sql_2016_branding_en-us(1bd6e667-f159-ac3b-f0a5-964c04ca5a13).cab"
Invoke-WebRequest -Uri "http://packages.mtps.microsoft.com/v2sql_shared_language_reference_b4621_sql_130_en-us_1(83748a56-8810-751f-d453-00c5accc862d).cab" `
	-OutFile "v2sql_shared_language_reference_b4621_sql_130_en-us_1(83748a56-8810-751f-d453-00c5accc862d).cab"
Invoke-WebRequest -Uri "http://packages.mtps.microsoft.com/v2sql_shared_language_reference_b4621_sql_130_en-us_2(ccc38276-b744-93bd-9008-fe79b294ff41).cab" `
	-OutFile "v2sql_shared_language_reference_b4621_sql_130_en-us_2(ccc38276-b744-93bd-9008-fe79b294ff41).cab"
- Create a text file name HelpContentSetup.msha in the same folder as the .cab files and paste the following html:
<html xmlns="http://www.w3.org/1999/xhtml">
<head />
<body class="vendor-book">
    <div class="details">
        <span class="vendor">Microsoft</span>
        <span class="locale">en-us</span>
        <span class="product">SQL Server 2016</span>
        <span class="name">Microsoft SQL Server Language Reference</span>
    </div>
    <div class="package-list">
        <div class="package">
            <span class="name">SQL_2016_Branding_en-US</span>
            <span class="deployed">False</span>
            <a class="current-link" href="sql_2016_branding_en-us(1bd6e667-f159-ac3b-f0a5-964c04ca5a13).cab">sql_2016_branding_en-us(1bd6e667-f159-ac3b-f0a5-964c04ca5a13).cab</a>
        </div>
        <div class="package">
            <span class="name">v2SQL_Shared_Language_Reference_B4621_SQL_130_en-us_1</span>
            <span class="deployed">False</span>
            <a class="current-link" href="v2sql_shared_language_reference_b4621_sql_130_en-us_1(83748a56-8810-751f-d453-00c5accc862d).cab">v2sql_shared_language_reference_b4621_sql_130_en-us_1(83748a56-8810-751f-d453-00c5accc862d).cab</a>
        </div>
        <div class="package">
            <span class="name">v2SQL_Shared_Language_Reference_B4621_SQL_130_en-us_2</span>
            <span class="deployed">False</span>
            <a class="current-link" href="v2sql_shared_language_reference_b4621_sql_130_en-us_2(ccc38276-b744-93bd-9008-fe79b294ff41).cab">v2sql_shared_language_reference_b4621_sql_130_en-us_2(ccc38276-b744-93bd-9008-fe79b294ff41).cab</a>
        </div>
    </div>
</body>
</html>
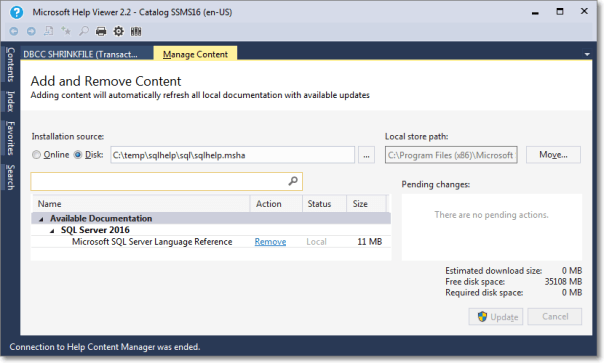
- First, set the Help Viewer to open help from the local sources:
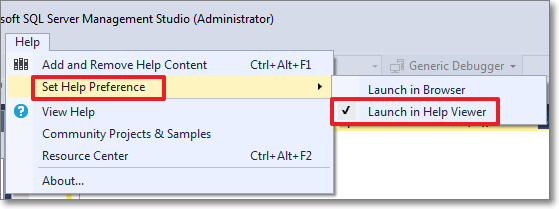
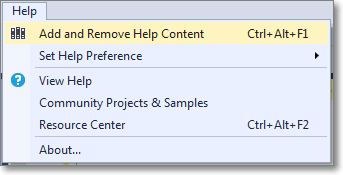
- Then select the “Add and Remove Help Content” command:
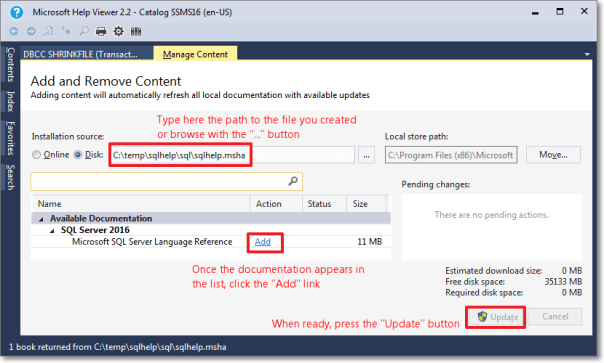
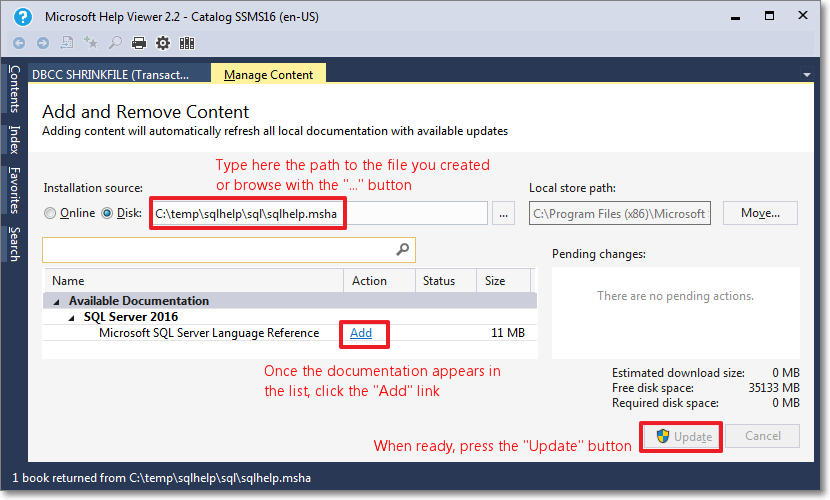
- This command opens the Help Viewer and asks for the content to add.
Browse to the file you created in step 3.
Click “Add” on all the items you wish to add to the library. In this case you will have only 1 item.
When done, click the “Update” button.
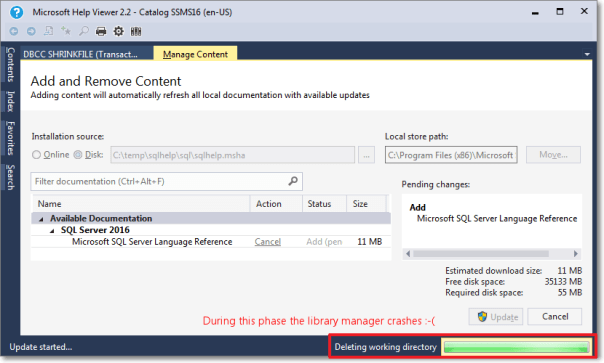
- Unfortunately, during the installation phase of the library item, something crashes and the installation won’t proceed until you tell it to ignore or report the error.
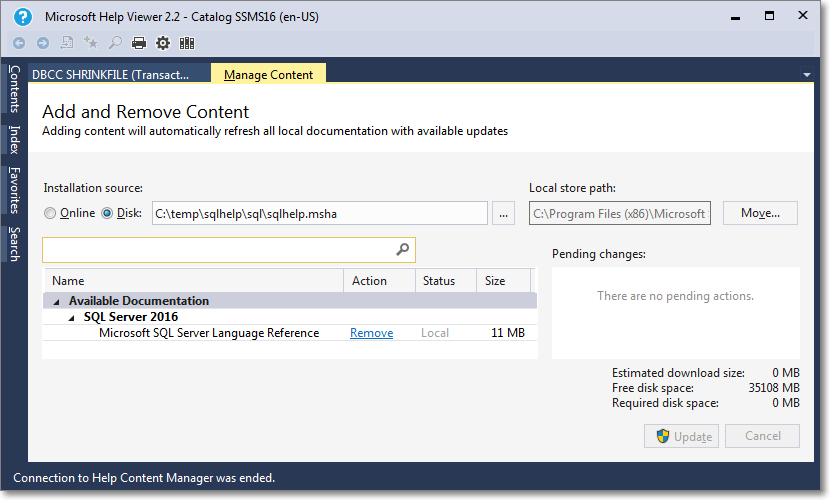
- Despite the crash, everything works as expected and you will find the topic installed in your help library:

Here it is, nice and easy. Hope it works for you too.
Weird Things Happen with Windows Users
This will be no surprise to those who have been working with SQL Server for a long time, but it can be puzzling at first and actually I was a bit confused myself when I stumbled upon this behavior for the first time.
SQL Server treats windows users in a special way, a way that could lead us to some interesting observations.
First of all, we need a test database and a couple of windows principals to perform our tests:
1. In a command prompt, create a windows group named ‘testGroup’
net localgroup testGroup /ADD
2. In a command prompt, create a windows user named ‘testUser’ and add it to the group
net user testUser "testUser" /ADD

net localgroup testGroup testUser /ADD
3. In SSMS, create a test database:
CREATE DATABASE testWindowsUser;
Now that everything is set up, we can start our investigation.
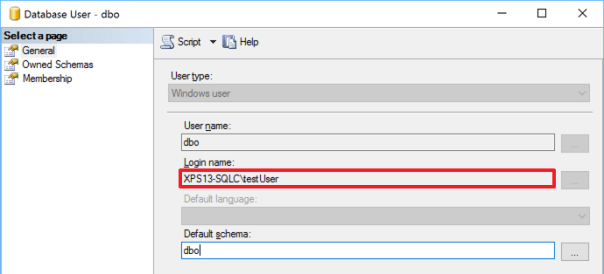
You can create a database user for a Windows user with no corresponding login
When dealing with windows users, you don’t need to create a login in SQL Server in order to create a database user, but you can create it directly:
USE testWindowsUser;
GO

CREATE USER [XPS13-SQLC\testUser];
GO
We just created a user in the database, without creating a login first and without having to add “WITHOUT LOGIN” to the CREATE USER statement. If you search for a login with the same SID in sys.logins, nothing will turn up:
SELECT svp.name AS login_name,
	dbp.name AS user_name,
	dbp.default_schema_name
FROM sys.database_principals AS dbp
LEFT JOIN sys.server_principals AS svp
	ON dbp.sid = svp.sid
WHERE dbp.name LIKE '%testUser';
login_name  user_name            default_schema_name
----------- -------------------- --------------------
NULL        XPS13-SQLC\testUser  dbo
It is interesting to note that the default schema for the user, if you don’t specify one, will be “dbo”.
At this point, the Windows user cannot log in to SQL Server, but the user can be impersonated to perform operations against the databases, in the same exact way as with any other user without login.
Before we proceed with the investigation, let’s clean up our mess:
DROP USER [XPS13-SQLC\testUser];
You can create a database user for a Windows group with no corresponding login
If we try to do the same thing with a Windows group, we get even more interesting findings.
USE testWindowsUser;
GO

CREATE USER [XPS13-SQLC\testGroup]
GO
Again, we did not have to specify an existing login name and we did not have to add “WITHOUT LOGIN”. Looking at the user data in sys.database_principals and sys.logins shows again that no login is associated with this user, but this time we can see that no default schema was set.
SELECT svp.name AS login_name,
	dbp.name AS user_name,
	dbp.default_schema_name
FROM sys.database_principals AS dbp
LEFT JOIN sys.server_principals AS svp
	ON dbp.sid = svp.sid
WHERE dbp.name LIKE '%testGroup';
login_name  user_name             default_schema_name
----------- --------------------- --------------------
NULL        XPS13-SQLC\testGroup  NULL
As common sense suggests, we cannot impersonate a database user that corresponds to a Windows group. If we try that, we are met with an error message.
EXECUTE AS USER = 'XPS13-SQLC\testGroup'; -- '
Msg 15517, Level 16, State 1, Line 85
Cannot execute as the database principal because the principal "XPS13-SQLC\testGroup" does not exist,
this type of principal cannot be impersonated, or you do not have permission.
Windows users are granted access through groups in surprising ways
Now the fun begins. Turns out that you can impersonate a Windows user that is not a user in the database, as long as the Windows user is a member of the group.
Let’s grant some permissions to the group and see what happens:
ALTER ROLE db_owner ADD MEMBER [XPS13-SQLC\testGroup];
GO

EXECUTE AS USER = 'XPS13-SQLC\testUser'; -- '
EXEC('CREATE VIEW testView AS SELECT 1 AS one');
REVERT;
GO
Surprisingly enough, we were able to impersonate a database principal that doesn’t exist at all. In fact we dropped it right before we started to play with the groups, right? Let’s check again the database principals:
SELECT svp.name AS login_name,
	dbp.name AS user_name,
	dbp.default_schema_name
FROM sys.database_principals AS dbp
LEFT JOIN sys.server_principals AS svp
	ON dbp.sid = svp.sid
WHERE dbp.name LIKE '%test%';
GO
login_name  user_name             default_schema_name
----------- --------------------- --------------------
NULL        XPS13-SQLC\testGroup  NULL
NULL        XPS13-SQLC\testUser   XPS13-SQLC\testUser
Wait, what? Who created that user? Looks like SQL Server creates the database user automatically when it needs to impersonate one of the group members that are not created in the database yet.
Another interesting fact is that the default schema of the newly created user matches the user name. If we don’t like that, we can change it afterwards, but wouldn’t it be cool if we could simply change that on the Windows group and let it propagate to the users created during this process? Let’s try and see if this is possible.
-- First let's drop the user and dependent objects
DROP VIEW [XPS13-SQLC\testUser].testView;
DROP SCHEMA [XPS13-SQLC\testUser];
DROP USER [XPS13-SQLC\testUser];
GO

-- Then let's change the default schema for the group
ALTER USER [XPS13-SQLC\testGroup] WITH default_schema = dbo;
GO

-- Let's re-create the view impersonating the user
EXECUTE AS USER = 'XPS13-SQLC\testUser'; -- '
EXEC('CREATE VIEW testView AS SELECT 1 AS One');
REVERT
GO

-- Check if the view is there
SELECT OBJECT_SCHEMA_NAME(object_id) AS schema_name, name
FROM sys.views
WHERE name = 'testView';
GO

-- Check database users:
SELECT svp.name AS login_name,
	dbp.name AS user_name,
	dbp.default_schema_name
FROM sys.database_principals AS dbp
LEFT JOIN sys.server_principals AS svp
	ON dbp.sid = svp.sid
WHERE dbp.name LIKE '%test%';
GO
schema_name  name
------------ ---------
dbo          testView

login_name   user_name             default_schema_name
------------ --------------------- --------------------
NULL         XPS13-SQLC\testGroup  dbo
This time the view was placed in the “dbo” schema as expected (remember? We set the default schema on the group), but the really weird thing is that no new user was added. Why? I couldn’t find any answer in the documentation. It is even more puzzling that SQL Server was able to impersonate a user that is not present at all. Nevertheless, as far as I can remember it has always been like this, at least starting from SQL Server 2005.
To be sure we’re not imagining things, let’s change again the default schema of the Windows group:
-- Note the weird syntax
ALTER USER [XPS13-SQLC\testGroup] WITH default_schema = NULL;
GO

-- Let's re-create the view impersonating the user
EXECUTE AS USER = 'XPS13-SQLC\testUser'; -- '
EXEC('CREATE VIEW testView AS SELECT 1 AS One');
REVERT
GO

-- Check if the view is there
SELECT OBJECT_SCHEMA_NAME(object_id) AS schema_name, name
FROM sys.views
WHERE name = 'testView';
GO

-- Check database users:
SELECT svp.name AS login_name,
	dbp.name AS user_name,
	dbp.default_schema_name
FROM sys.database_principals AS dbp
LEFT JOIN sys.server_principals AS svp
	ON dbp.sid = svp.sid
WHERE dbp.name LIKE '%test%';
GO
schema_name          name
-------------------- ---------------------
dbo                  testView
XPS13-SQLC\testUser  testView

login_name           user_name             default_schema_name
-------------------- --------------------- --------------------
NULL                 XPS13-SQLC\testGroup  NULL
NULL                 XPS13-SQLC\testUser   XPS13-SQLC\testUser
Again, SQL Server creates a new user and assigns it a default schema with the same name. The view was placed in the user’s default schema.
Now let’s revert to a clean database and drop some objects.
DROP VIEW dbo.testView;
DROP VIEW [XPS13-SQLC\testUser].testView;
DROP SCHEMA [XPS13-SQLC\testUser];
DROP USER [XPS13-SQLC\testUser];
GO
In order to have a complete picture, we can now check what happens if we create a login for the windows user.
CREATE LOGIN [XPS13-SQLC\testUser] FROM WINDOWS;
GO

EXECUTE AS LOGIN = 'XPS13-SQLC\testUser';
EXEC('CREATE VIEW testView AS SELECT 1 AS One');
REVERT
GO

-- Check if the view is there
SELECT OBJECT_SCHEMA_NAME(object_id) AS schema_name, name
FROM sys.views
WHERE name = 'testView';
GO

-- Check database users:
SELECT svp.name AS login_name,
	dbp.name AS user_name,
	dbp.default_schema_name
FROM sys.database_principals AS dbp
LEFT JOIN sys.server_principals AS svp
	ON dbp.sid = svp.sid
WHERE dbp.name LIKE '%test%';
GO
schema_name          name
-------------------- ---------------------
XPS13-SQLC\testUser  testView


login_name           user_name             default_schema_name
-------------------- --------------------- --------------------
NULL                 XPS13-SQLC\testGroup  NULL
XPS13-SQLC\testUser  XPS13-SQLC\testUser   XPS13-SQLC\testUser
Again, SQL Server creates a new database user for this login and a schema with the same name. The view gets added to the user’s default schema.
What is interesting to note is that we could access the database by logging in as the Windows user, without having an explicit permission path to allow it. Only after accessing the database an explicit database user is created.
If we try the same thing with the default schema set to “dbo” on the windows group, the behavior matches what we got for the user:
-- let's try again with a default schema on the group
ALTER USER [XPS13-SQLC\testGroup] WITH default_schema = dbo;
GO

-- cleanup
DROP VIEW dbo.testView;
DROP VIEW [XPS13-SQLC\testUser].testView;
DROP SCHEMA [XPS13-SQLC\testUser];
DROP USER [XPS13-SQLC\testUser];
GO

EXECUTE AS LOGIN = 'XPS13-SQLC\testUser'; -- '
EXEC('CREATE VIEW testView AS SELECT 1 AS One');
REVERT
GO

-- Check if the view is there
SELECT OBJECT_SCHEMA_NAME(object_id) AS schema_name, name
FROM sys.views
WHERE name = 'testView';
GO

-- Check database users:
SELECT svp.name AS login_name,
	dbp.name AS user_name,
	dbp.default_schema_name
FROM sys.database_principals AS dbp
LEFT JOIN sys.server_principals AS svp
	ON dbp.sid = svp.sid
WHERE dbp.name LIKE '%test%';
GO
This means that this behavior has to be taken into account when we’re querying permissions on the databases to see who can access what. In order to know whether a windows user is member of a windows group, we can use the system function IS_MEMBER().
In our case, it would be enough to call the function in this way:
EXECUTE AS LOGIN = 'XPS13-SQLC\testUser'; -- '
SELECT IS_MEMBER('XPS13-SQLC\testGroup');
REVERT
GO
Unfortunately, there is no additional parameter available to specify which windows user to test for group membership and the function will always test against the current login. This has two important consequences:
- To test multiple logins, we need to impersonate them one at a time, which is difficult to achieve in scripts.
- There is no way to test database users: impersonating the database user will not be enough to test the windows group membership for the windows user associated to the database user.
Summing it up, this is what we have:
| Windows user impersonated as | Group’s Default Schema set | New user added | New user’s schema |
|---|---|---|---|
| Database User | No | Yes | User name |
| Database User | Yes | No | – |
| Login | No | Yes | User name |
| Login | Yes | No | – |
The dbo user can be mapped to a non-existing Windows User
This is extremely tricky and I was bitten by this behavior recently, wasting countless hours trying to figure out what was happening.
Imagine that a developer creates a database in the development environment, while logged in with Windows authentication. This is a very common scenario, both if you’re using a centralized development server or developers’ workstations.
When development is complete, the developer hands us a database backup to restore in production, because the database already contains some data (built-in values in lookup tables or something else required by the application). We restore the database in production, where the developer does not have a login, confident that he will be unable to access it. Well, that’s not exactly what is going to happen.
Let’s see it with an example:
-- Grant dbcreator permissions to the windows user
ALTER SERVER ROLE dbcreator ADD MEMBER [XPS13-SQLC\testUser]
GO

-- The user creates a database. It may happen in development, right?
EXECUTE AS LOGIN = 'XPS13-SQLC\testUser';
CREATE DATABASE testWindowsGroup
REVERT
GO

-- Let's pretend that developers finish working with the database
-- and ask to move it from development to production
-- He takes a backup and we restore it to production
BACKUP DATABASE testWindowsGroup TO DISK = 'c:\temp\testWindowsGroup.bak';
GO

-- We don't have two separate servers to test, we will simulate
-- the same situation by dropping some objects. Let's drop the database.
DROP DATABASE testWindowsGroup;
GO

-- Now let's drop the associated windows login
DROP LOGIN [XPS13-SQLC\testUser]
GO

-- The database gets restored in production (again, we will use the same instance,
-- but the main point is that the login of the database owner is not present).
RESTORE DATABASE testWindowsGroup FROM DISK = 'c:\temp\testWindowsGroup.bak'
GO

-- Who's the owner of the database? You, the DBA. Looking good.
SELECT db.name, svp.name
FROM sys.databases AS db
INNER JOIN sys.server_principals AS svp
	ON db.owner_sid = svp.sid
WHERE database_id = DB_ID('testWindowsGroup');
Everything is set up the way it should: the database is restored to production, the DBA is the database owner, the developer has no access to the database and everybody is happy.
Now imagine that a new totally unrelated database gets added to the production instance, a database where everybody in the company must have read-only access. We create a new login for a Windows group that includes all authorized logins and we grant access to the new database.
Again, let’s see it with an example (using tempdb):
-- Let's add a login for the group and grant permissions on another database
-- I will use tempdb here, but it could be any other database.
CREATE LOGIN [XPS13-SQLC\testGroup] FROM WINDOWS;
GO

USE tempdb;
GO

-- The group gets added to tempdb with read-only permissions
CREATE USER [XPS13-SQLC\testGroup] FOR LOGIN [XPS13-SQLC\testGroup];
ALTER ROLE db_datareader ADD MEMBER [XPS13-SQLC\testGroup];
GO

-- Let’s go back to the database we restored previously
USE testWindowsGroup;
GO

-- Now see what happens:
EXECUTE AS LOGIN = 'XPS13-SQLC\testUser'; -- '
EXEC('CREATE VIEW testView AS SELECT 1 AS One');
REVERT
GO
WTF? A windows user that has no matching SQL Server login could create a view in a database where no matching user exists? How could that happen?
-- Let's check the permissions of this user:
EXECUTE AS LOGIN = 'XPS13-SQLC\testUser'; -- '
SELECT IS_ROLEMEMBER('db_owner') AS IAmDbOwner,
	IS_MEMBER('db_owner') AS AgainDbOwner;
REVERT
GO
IAmDbOwner	AgainDbOwner
----------- -------------
          1             1
Weird. The login of the Windows user seems to be the database owner, but we checked upon restore that the DBA is the database owner. Moreover, there is no explicit login in the server for this Windows user and the only Windows group that contains this user does not have access at all to the database: how is this possible?
The answer is buried inside the database principals table:
-- The sid of the dbo user is still the sid of the user that created the database,
-- even if the windows user is not a login in SQL Server
SELECT sid
FROM sys.database_principals
WHERE name = 'dbo';
We got access to the database thanks to a windows group added to grant access to a totally unrelated database. The group has no permissions whatsoever on the database, but it allows its members to log in: the actual permissions on the database are granted through the SID of the dbo user.
This can be spotted immediately with the GUI, which is a fact that hides the resolution even more from experienced DBAs that don’t use the GUI at all.
Bottom line
Windows authentication comes handy most of the times and it offers better protection compared to SQL Server authentication, but sometimes the way SQL Server treats Windows users can be puzzling.
Don’t take things for granted and check now if you really understand who has access to your databases: the answer might be very different from what you expect.
P.S. If you’re wondering why I placed a comment with a quote after every “EXECUTE AS” statement, it’s just to fix this WordPress wacky syntax highlighter going nuts.
Counting the number of rows in a table
Don’t be fooled by the title of this post: while counting the number of rows in a table is a trivial task for you, it is not trivial at all for SQL Server.
Every time you run your COUNT(*) query, SQL Server has to scan an index or a heap to calculate that seemingly innocuous number and send it to your application. This means a lot of unnecessary reads and unnecessary blocking.
Jes Schultz Borland blogged about it some time ago and also Aaron Bertrand has a blog post on this subject. I will refrain from repeating here what they both said: go read their blogs to understand why COUNT(*) is a not a good tool for this task.
The alternative to COUNT(*) is reading the count from the table metadata, querying sys.partitions, something along these lines:
SELECT SUM(p.rows)
FROM sys.partitions p
WHERE p.object_id = OBJECT_ID('MyTable')
    AND p.index_id IN (0,1); -- heap or clustered index
Many variations of this query include JOINs to sys.tables, sys.schemas or sys.indexes, which are not strictly necessary in my opinion. However, the shortest version of the count is still quite verbose and error prone.
Fortunately, there’s a shorter version of this query that relies on the system function OBJECTPROPERTYEX:
SELECT OBJECTPROPERTYEX(OBJECT_ID('MyTable'),'cardinality')
Where does it read data from? STATISTICS IO doesn’t return anything for this query, so I had to set up an Extended Events session to capture lock_acquired events and find out the system tables read by this function:

Basically, it’s just sysallocunits and sysrowsets.
It’s nice, short and easy to remember. Enjoy.
Tracking Table Usage and Identifying Unused Objects
One of the things I hate the most about “old” databases is the fact that unused tables are kept forever, because nobody knows whether they’re used or not. Sometimes it’s really hard to tell. Some databases are accessed by a huge number of applications, reports, ETL tools and God knows what else. In these cases, deciding whether you should drop a table or not is a tough call.
Search your codebase
The easiest way to know if a table is used, is to search the codebase for occurences of the table name. However, finding the table name in the code does not mean it is used: there are code branches that in turn are not used. Modern languages and development tools can help you identify unused methods and objects, but it’s not always feasible or 100% reliable (binary dependencies, scripts, dynamic code are, off top of my head, some exceptions).
On the other hand, not finding the table name in the code does not mean you can delete it with no issues. The table could be used by dynamic code and the name retrieved from a configuration file or a table in the database.
In other cases, the source code is not available at all.
Index usage: clues, not evidence
Another way to approach the problem is by measuring the effects of the code execution against the database, in other words, by looking at the information stored by SQL Server whenever a table is accessed.
The DMV sys.dm_db_index_usage_stats records information on all seeks, scans, lookups and updates against indexes and is a very good place to start the investigation. If something is writing to the table or reading from it, you will see the numbers go up and the dates moving forward.
Great, so we’re done and this post is over? Not exactly: there are some more facts to take into account.
First of all, the DMV gets cleared every time SQL Server is restarted, so the accuracy of the data returned is heavily dependant on how long the instance has been running. Moreover, some actions (rebuilding the index, to name one) reset the index usage stats and if you want to rely on sensible stats, your only option is to persist the data in some place regularly.
To achieve this goal, I coded this simple stored procedure that reads the stats from the DMV and stores it in a table, updating the read and write counts for each subsequent execution.
-- You have a TOOLS database, right?
-- If not, create one, you will thank me later
USE TOOLS;
GO

-- A place for everything, everything in its place
IF SCHEMA_ID('meta') IS NULL
	EXEC('CREATE SCHEMA meta;')
GO

-- This table will hold index usage summarized at table level
CREATE TABLE meta.index_usage(
       db_name sysname,
       schema_name sysname,
       object_name sysname,
       read_count bigint,
       last_read datetime,
       write_count bigint,
       last_write datetime,
       PRIMARY KEY CLUSTERED (db_name, schema_name, object_name)
)

-- This table will hold the last snapshot taken
-- It will be used to capture the snapshot and
-- merge it with the destination table
CREATE TABLE meta.index_usage_last_snapshot(
       db_name sysname,
       schema_name sysname,
       object_name sysname,
       read_count bigint,
       last_read datetime,
       write_count bigint,
       last_write datetime,
       PRIMARY KEY CLUSTERED (db_name, schema_name, object_name)
)
GO

-- This procedure captures index usage stats
-- and merges the stats with the ones already captured
CREATE PROCEDURE meta.record_index_usage
AS
BEGIN

SET NOCOUNT ON;

IF OBJECT_ID('tempdb..#stats') IS NOT NULL
       DROP TABLE #stats;

-- We will use the index stats multiple times, so parking
-- them in a temp table is convenient
CREATE TABLE #stats(
       db_name sysname,
       schema_name sysname,
       object_name sysname,
       read_count bigint,
       last_read datetime,
       write_count bigint,
       last_write datetime,
       PRIMARY KEY CLUSTERED (db_name, schema_name, object_name)
);

-- Reads index usage stats and aggregates stats at table level
-- Aggregated data is saved in the temporary table
WITH index_stats AS (
       SELECT DB_NAME(database_id) AS db_name,
              OBJECT_SCHEMA_NAME(object_id,database_id) AS schema_name,
              OBJECT_NAME(object_id, database_id) AS object_name,
              user_seeks + user_scans + user_lookups AS read_count,
              user_updates AS write_count,
              last_read = (
                  SELECT MAX(value)
                  FROM (
                      VALUES(last_user_seek),(last_user_scan),(last_user_lookup)
                  ) AS v(value)
              ),
              last_write = last_user_update
       FROM sys.dm_db_index_usage_stats
       WHERE DB_NAME(database_id) NOT IN ('master','model','tempdb','msdb')
)
INSERT INTO #stats
SELECT db_name,
       schema_name,
       object_name,
       SUM(read_count) AS read_count,
       MAX(last_read) AS last_read,
       SUM(write_count) AS write_count,
       MAX(last_write) AS last_write
FROM index_stats
GROUP BY db_name,
       schema_name,
       object_name;

DECLARE @last_date_in_snapshot datetime;
DECLARE @sqlserver_start_date datetime;

-- reads maximum read/write date from the data already saved in the last snapshot table
SELECT @last_date_in_snapshot = MAX(CASE WHEN last_read > last_write THEN last_read ELSE last_write END)
FROM meta.index_usage_last_snapshot;

-- reads SQL Server start time
SELECT @sqlserver_start_date = sqlserver_start_time FROM sys.dm_os_sys_info;

-- handle restarted server: last snapshot is before server start time
IF (@last_date_in_snapshot) < (@sqlserver_start_date)
       TRUNCATE TABLE meta.index_usage_last_snapshot;

-- handle snapshot table empty
IF NOT EXISTS(SELECT * FROM meta.index_usage_last_snapshot)
       INSERT INTO meta.index_usage_last_snapshot
       SELECT * FROM #stats;

-- merges data in the target table with the new collected data
WITH offset_stats AS (
       SELECT newstats.db_name,
              newstats.schema_name,
              newstats.object_name,
              -- if new < old, the stats have been reset
              newstats.read_count -
                  CASE
                      WHEN newstats.read_count < ISNULL(oldstats.read_count,0) THEN 0
                      ELSE ISNULL(oldstats.read_count,0)
                  END
                  AS read_count,
              newstats.last_read,
              -- if new < old, the stats have been reset
              newstats.write_count -
                  CASE
                      WHEN newstats.write_count < ISNULL(oldstats.write_count,0) THEN 0
                      ELSE ISNULL(oldstats.write_count,0)
                  END
              AS write_count,
              newstats.last_write
       FROM #stats AS newstats
       LEFT JOIN meta.index_usage_last_snapshot AS oldstats
              ON newstats.db_name = oldstats.db_name
              AND newstats.schema_name = oldstats.schema_name
              AND newstats.object_name = oldstats.object_name
)
MERGE INTO meta.index_usage AS dest
USING offset_stats AS src
       ON src.db_name = dest.db_name
       AND src.schema_name = dest.schema_name
       AND src.object_name = dest.object_name
WHEN MATCHED THEN
       UPDATE SET read_count += src.read_count,
              last_read = src.last_read,
              write_count += src.write_count,
              last_write = src.last_write
WHEN NOT MATCHED BY TARGET THEN
       INSERT VALUES (
           src.db_name,
           src.schema_name,
           src.object_name,
           src.read_count,
           src.last_read,
           src.write_count,
           src.last_write
       );

-- empty the last snapshot
TRUNCATE TABLE meta.index_usage_last_snapshot;

-- replace it with the new collected data
INSERT INTO meta.index_usage_last_snapshot
SELECT * FROM #stats;

END

GO
You can schedule the execution of the stored procedure every hour or so and you will see data flow in the meta.index_usage_last_snapshot table. Last read/write date will be updated and the read/write counts will be incremented by comparing saved counts with the captured ones: if I had 1000 reads in the previous snapshot and I capture 1200 reads, the total reads column must be incremented by 200.
So, if I don’t find my table in this list after monitoring for some days, is it safe to assume that it can be deleted? Probably yes. More on that later.
What these stats don’t tell you is what to do when you do find the table in the list. It would be reasonable to think that the table is used, but there are several reasons why it may have ended up being read or written and not all of them will be ascribable to an application.
For instance, if a table is merge replicated, the replication agents will access it and read counts will go up. What the index usage stats tell us is that something is using a table but it says nothing about the nature of that something. If you want to find out more, you need to set up some kind of monitoring that records additional information about where reads and writes come from.
Extended Events to the rescue
For this purpose, an audit is probably too verbose, because it will record an entry for each access to each table being audited. The audit file will grow very quickly if not limited to a few objects to investigate. Moreover, audits have to be set up for each table and kept running for a reasonable time before drawing conclusions.
Audits are based on Extended Events: is there another way to do the same thing Audits do using extended events directly? Of course there is, but it’s trickier than you would expect.
First of all, the Extended Events used by the audit feature are not available directly. You’ve been hearing several times that audits use Extended Events but nobody ever told you which events they are using: the reason is that those events are not usable in a custom Extended Events session (the SecAudit package is marked as “private”). As a consequence, if you want to audit table access, you will have to use some other kind of event.
In order to find out which Extended Events provide information at the object level, we can query the sys.dm_xe_object_columns DMV:
SELECT object_name, description
FROM sys.dm_xe_object_columns
WHERE name = 'object_id'
As you will see, the only event that could help in this case is the lock_acquired event. Whenever a table is accessed, a lock will be taken and capturing those locks is a quick and easy way to discover activity on the tables.
Here is the definition of a session to capture locking information:
CREATE EVENT SESSION [audit_table_usage] ON SERVER
ADD EVENT sqlserver.lock_acquired (
    SET collect_database_name = (0)
        ,collect_resource_description = (1)
    ACTION(sqlserver.client_app_name, sqlserver.is_system, sqlserver.server_principal_name)
    WHERE (
        [package0].[equal_boolean]([sqlserver].[is_system], (0)) -- user SPID
        AND [package0].[equal_uint64]([resource_type], (5)) -- OBJECT
        AND [package0].[not_equal_uint64]([database_id], (32767))  -- resourcedb
        AND [package0].[greater_than_uint64]([database_id], (4)) -- user database
        AND [package0].[greater_than_equal_int64]([object_id], (245575913)) -- user object
        AND (
               [mode] = (1) -- SCH-S
            OR [mode] = (6) -- IS
            OR [mode] = (8) -- IX
            OR [mode] = (3) -- S
            OR [mode] = (5) -- X
        )
    )
)
WITH (
     MAX_MEMORY = 20480 KB
    ,EVENT_RETENTION_MODE = ALLOW_MULTIPLE_EVENT_LOSS
    ,MAX_DISPATCH_LATENCY = 30 SECONDS
    ,MAX_EVENT_SIZE = 0 KB
    ,MEMORY_PARTITION_MODE = NONE
    ,TRACK_CAUSALITY = OFF
    ,STARTUP_STATE = OFF
);
GO
If you start this session and monitor the data captured with the “Watch live data” window, you will soon notice that a huge number of events gets captured, which means that the output will also be huge and analyzing it can become a daunting task. Saving this data to a file target is not the way to go here: is there another way?
The main point here is that there is no need for the individual events, but the interesting information is the aggregated data from those events. Ideally, you would need to group by object_id and get the maximum read or write date. If possible, counting reads and writes by object_id would be great. At a first look, it seems like a good fit for the histogram target, however you will soon discover that the histogram target can “group” on a single column, which is not what you want. Object_ids are not unique and you can have the same object_id in different databases. Moreover, the histogram target can only count events and is not suitable for other types of aggregation, such as MAX.
Streaming the events with Powershell
Fortunately, when something is not available natively, you can code your own implementation. In this case, you can use the Extended Events streaming API to attach to the session and evaluate the events as soon as they show up in the stream.
In this example, I will show you how to capture the client application name along with the database and object id and group events on these 3 fields. If you are interested in additional fields (such as host name or login name), you will need to group by those fields as well.
In the same way, if you want to aggregate additional fields, you will have to implement your own logic. In this example, I am computing the MAX aggregate for the read and write events, without computing the COUNT. The reason is that it’s not easy to predict whether the count will be accurate or not, because different kind of locks will be taken in different situations (under snapshot isolation no shared locks are taken, so you have to rely on SCH-S locks; when no dirty pages are present SQL Server takes IS locks and not S locks…).
Before going to the Powershell code, you will need two tables to store the information:
USE TOOLS;
GO
CREATE TABLE meta.table_usage_xe(
       db_name sysname,
       schema_name sysname,
       object_name sysname,
       client_app_name nvarchar(128),
       last_read datetime,
       last_write datetime,
       PRIMARY KEY(db_name, schema_name, object_name, client_app_name)
);

CREATE TABLE meta.table_usage_xe_last_snapshot(
       database_id int,
       object_id int,
       client_app_name nvarchar(128),
       last_read datetime,
       last_write datetime,
       PRIMARY KEY(database_id, object_id, client_app_name)
);
Now that you have a nice place to store the aggregated information, you can start this script to capture the events and persist them.
sl $Env:Temp

#For SQL Server 2014:
Add-Type -Path 'C:\Program Files\Microsoft SQL Server\120\Shared\Microsoft.SqlServer.XE.Core.dll'
Add-Type -Path 'C:\Program Files\Microsoft SQL Server\120\Shared\Microsoft.SqlServer.XEvent.Linq.dll'
#For SQL Server 2012:
#Add-Type -Path 'C:\Program Files\Microsoft SQL Server\110\Shared\Microsoft.SqlServer.XEvent.Linq.dll'

$connectionString = 'Data Source = YourServerNameGoesHere; Initial Catalog = master; Integrated Security = SSPI'

$SessionName = "audit_table_usage"

# loads all object ids for table objects and their database id
# table object_ids will be saved in order to rule out whether
# the locked object is a table or something else.
$commandText = "
DECLARE @results TABLE (
       object_id int,
       database_id int
);

DECLARE @sql nvarchar(max);

SET @sql = '
       SELECT object_id, db_id()
       FROM sys.tables t
       WHERE is_ms_shipped = 0
';

DECLARE @statement nvarchar(max);

SET @statement = (
       SELECT 'EXEC ' + QUOTENAME(name) + '.sys.sp_executesql @sql; '
       FROM sys.databases d
       WHERE name NOT IN ('master','model','msdb','tempdb')
       FOR XML PATH(''), TYPE
).value('.','nvarchar(max)');

INSERT @results
EXEC sp_executesql @statement, N'@sql nvarchar(max)', @sql;

SELECT *
FROM @results
"

$objCache = @{}

$conn = New-Object -TypeName System.Data.SqlClient.SqlConnection -ArgumentList $connectionString
$cmd = New-Object -TypeName System.Data.SqlClient.SqlCommand
$cmd.CommandText = $commandText
$cmd.Connection = $conn
$conn.Open()
$conn.ChangeDatabase("master")
$rdr = $cmd.ExecuteReader()

# load table object_ids and store them in a hashtable

while ($rdr.Read()) {
	$objId = $rdr.GetInt32(0)
	$dbId = $rdr.GetInt32(1)
	if(-not $objCache.ContainsKey($objId)){
		$objCache.add($objId,@($dbId))
	}
	else {
		$arr = $objCache.Get_Item($objId)
		$arr += $dbId
		$objCache.set_Item($objId, $arr)
	}
}

$conn.Close()

# create a DataTable to hold lock information in memory
$queue = New-Object -TypeName System.Data.DataTable
$queue.TableName = $SessionName

[Void]$queue.Columns.Add("database_id",[Int32])
[Void]$queue.Columns.Add("object_id",[Int32])
[Void]$queue.Columns.Add("client_app_name",[String])
[Void]$queue.Columns.Add("last_read",[DateTime])
[Void]$queue.Columns.Add("last_write",[DateTime])

# create a DataView to perform searches in the DataTable
$dview = New-Object -TypeName System.Data.DataView
$dview.Table = $queue
$dview.Sort = "database_id, client_app_name, object_id"

$last_dump = [DateTime]::Now

# connect to the Extended Events session
[Microsoft.SqlServer.XEvent.Linq.QueryableXEventData] $events = New-Object -TypeName Microsoft.SqlServer.XEvent.Linq.QueryableXEventData `
    -ArgumentList @($connectionString, $SessionName, [Microsoft.SqlServer.XEvent.Linq.EventStreamSourceOptions]::EventStream, [Microsoft.SqlServer.XEvent.Linq.EventStreamCacheOptions]::DoNotCache)

$events | % {
    $currentEvent = $_

	$database_id = $currentEvent.Fields["database_id"].Value
	$client_app_name = $currentEvent.Actions["client_app_name"].Value
	if($client_app_name -eq $null) { $client_app_name = [string]::Empty }
	$object_id = $currentEvent.Fields["object_id"].Value
	$mode = $currentEvent.Fields["mode"].Value

	# search the object id in the object cache
	# if found (and database id matches) ==> table
	# otherwise ==> some other kind of object (not interesting)
	if($objCache.ContainsKey($object_id) -and $objCache.Get_Item($object_id) -contains $database_id)
	{
		# search the DataTable by database_id, client app name and object_id
		$found_rows = $dview.FindRows(@($database_id, $client_app_name, $object_id))

		# if not found, add a row
		if($found_rows.Count -eq 0){
			$current_row = $queue.Rows.Add()
			$current_row["database_id"] = $database_id
			$current_row["client_app_name"] = $client_app_name
			$current_row["object_id"] = $object_id
		}
		else {
			$current_row = $found_rows[0]
		}

		if(($mode.Value -eq "IX") -or ($mode.Value -eq "X")) {
			# Exclusive or Intent-Exclusive lock: count this as a write
			$current_row["last_write"] = [DateTime]::Now
		}
		else {
			# Shared or Intent-Shared lock: count this as a read
			# SCH-S locks counted here as well (snapshot isolation ==> no shared locks)
			$current_row["last_read"] = [DateTime]::Now
		}
    }

	$ts = New-TimeSpan -Start $last_dump -End (get-date)

	# Dump to database every 5 minutes
	if($ts.TotalMinutes -gt 5) {
		$last_dump = [DateTime]::Now

		# BCP data to the staging table TOOLS.meta.table_usage_xe_last_snapshot
		$bcp = New-Object -TypeName System.Data.SqlClient.SqlBulkCopy -ArgumentList @($connectionString)
		$bcp.DestinationTableName = "TOOLS.meta.table_usage_xe_last_snapshot"
		$bcp.Batchsize = 1000
		$bcp.BulkCopyTimeout = 0

		$bcp.WriteToServer($queue)

		# Merge data with the destination table TOOLS.meta.table_usage_xe
		$statement = "
			BEGIN TRANSACTION

			BEGIN TRY

				MERGE INTO meta.table_usage_xe AS dest
				USING (
					SELECT db_name(database_id) AS db_name,
						object_schema_name(object_id, database_id) AS schema_name,
						object_name(object_id, database_id) AS object_name,
						client_app_name,
						last_read,
						last_write
					FROM meta.table_usage_xe_last_snapshot
				) AS src
					ON src.db_name = dest.db_name
					AND src.schema_name = dest.schema_name
					AND src.object_name = dest.object_name
					AND src.client_app_name = dest.client_app_name
				WHEN MATCHED THEN
					UPDATE SET last_read = src.last_read,
						last_write = src.last_write
				WHEN NOT MATCHED THEN
					INSERT (db_name, schema_name, object_name, client_app_name, last_read, last_write)
					VALUES (db_name, schema_name, object_name, client_app_name, last_read, last_write);

				TRUNCATE TABLE meta.table_usage_xe_last_snapshot;

				COMMIT;

			END TRY
			BEGIN CATCH
				ROLLBACK;
				THROW;
			END CATCH
		"

		$conn = New-Object -TypeName System.Data.SqlClient.SqlConnection -ArgumentList $connectionString
		$cmd = New-Object -TypeName System.Data.SqlClient.SqlCommand
		$cmd.CommandText = $statement
		$cmd.Connection = $conn
		$conn.Open()
		$conn.ChangeDatabase("TOOLS")
		[Void]$cmd.ExecuteNonQuery()
		$conn.Close()

		$queue.Rows.Clear()

	}

}
WARNING: Be careful running this script against a production server: I tried it with a reasonaly busy server and the CPU/memory load of powershell.exe is non-negligible. On the other hand, the load imposed by the session per se is very low: make sure you run this script from a different machine and not on the database server.
What to do with unused objects
After monitoring for a reasonable amount of time, you will start to notice that some objects are never used and you will probably want to delete them. Don’t!
In my experience, as soon as you delete an object, something that uses it (and you didn’t capture) pops up and fails. In those cases, you want to restore the objects very quickly. I usually move everything to a “trash” schema and have it sitting there for some time (six months/one year) and eventually empty the trash. If somebody asks for a restore, it’s just as simple as an ALTER SCHEMA … TRANSFER statement.
Bottom line
Cleaning up clutter from a database is not simple: hopefully the techniques in this post will help you in the task. Everything would be much simpler if the Extended Events histogram target was more flexible, but please keep in mind that it’s not about the tools: these techniques can help you identify unused objects when no other information is available, but nothing is a good substitute for a correct use of the database. When new tables are added to a database, keep track of the request and take notes about who uses the tables for which purpose: everything will be much easier in the long run.
Another good reason to avoid AUTO_CLOSE
Does anybody need another good reason to avoid setting AUTO_CLOSE on a database? Looks like I found one.
Some days ago, all of a sudden, a database started to throw errors along the lines of “The log for database MyDatabase is not available”. The instance was an old 2008 R2 Express (don’t get me started on why an Express Edition is in production…) with some small databases.
The log was definitely there and the database looked online. Actually, I was able to query the tables, but every attempt to update the contents ended up with the “log unavailable” error.
Then I opened the ERRORLOG and found something really interesting: lots and lots of entries similar to “Starting up database MyDatabase” over and over… Does it ring a bell?
Yes, it’s AUTO_CLOSE
Looks like SQL Server closed the database and failed to open it completely, hence the “log unavailable” errors.
What should be done now to bring the database back to normal behaviour? Simply bring the database offline and then back online:
ALTER DATABASE MyDatabase SET OFFLINE;
ALTER DATABASE MyDatabase SET ONLINE;
And while we’re at it, let’s disable AUTO_CLOSE:
ALTER DATABASE MyDatabase SET AUTO_CLOSE OFF;
How can such a situation be prevented? There are many ways to accomplish this, ranging from PBM (Policy Based Management) to scheduled T-SQL health checks (see sp_blitz for instance).
See? Best practices are not for losers!
Installing SQL Server 2014 Language Reference Help from disk
Some weeks ago I had to wipe my machine and reinstall everything from scratch, SQL Server included.
For some reason that I still don’t understand, SQL Server Management Studio installed fine, but I couldn’t install Books Online from the online help repository. Unfortunately, installing from offline is not an option with SQL Server 2014, because the installation media doesn’t include the Language Reference documentation.
The issue is well known: Aaron Bertrand blogged about it back in april when SQL Server 2014 came out and he updated his post in august when the documentation was finally completely published. He also blogged about it at SQLSentry.
However, I couldn’t get that method to work: the Help Library Manager kept firing errors as soon as I clicked the “Install from Online” link. The error message was “An exception has occurred. See the event log for details.”
Needless to say that the event log had no interesting information to add.
If you are experiencing the same issue, here is a method to install the language reference from disk without downloading the help content from the Help Library Manager:
1 . Open a web browser and point it to the following url: http://services.mtps.microsoft.com/ServiceAPI/products/dd433097/dn632688/books/dn754848/en-us
2. Download the individual .cab files listed in that page to a location in your disk (e.g. c:\temp\langref\)
3. Create a text file name HelpContentSetup.msha in the same folder as the .cab files and paste the following html:
<html xmlns="http://www.w3.org/1999/xhtml">
<head />
<body class="vendor-book">
    <div class="details">
        <span class="vendor">Microsoft</span>
        <span class="locale">en-us</span>
        <span class="product">SQL Server 2014</span>
        <span class="name">Microsoft SQL Server Language Reference</span>
    </div>
    <div class="package-list">
        <div class="package">
            <span class="name">SQL_Server_2014_Books_Online_B4164_SQL_120_en-us_1</span>
            <span class="deployed">False</span>
            <a class="current-link" href="sql_server_2014_books_online_b4164_sql_120_en-us_1(0b10b277-ad40-ef9d-0d66-22173fb3e568).cab">sql_server_2014_books_online_b4164_sql_120_en-us_1(0b10b277-ad40-ef9d-0d66-22173fb3e568).cab</a>
        </div>
        <div class="package">
            <span class="name">SQL_Server_2014_Microsoft_SQL_Server_Language_Reference_B4246_SQL_120_en-us_1</span>
            <span class="deployed">False</span>
            <a class="current-link" href="sql_server_2014_microsoft_sql_server_language_reference_b4246_sql_120_en-us_1(5c1ad741-d0e3-a4a8-d9c0-057e2ddfa6e1).cab">sql_server_2014_microsoft_sql_server_language_reference_b4246_sql_120_en-us_1(5c1ad741-d0e3-a4a8-d9c0-057e2ddfa6e1).cab</a>
        </div>
        <div class="package">
            <span class="name">SQL_Server_2014_Microsoft_SQL_Server_Language_Reference_B4246_SQL_120_en-us_2</span>
            <span class="deployed">False</span>
            <a class="current-link" href="sql_server_2014_microsoft_sql_server_language_reference_b4246_sql_120_en-us_2(24815f90-9e36-db87-887b-cf20727e5e73).cab">sql_server_2014_microsoft_sql_server_language_reference_b4246_sql_120_en-us_2(24815f90-9e36-db87-887b-cf20727e5e73).cab</a>
        </div>
    </div>
</body>
</html>
4 . Open the Help Library Manager and select “Install content from disk”
5. Browse to the .msha you just created and click Next

6. The SQL Server 2014 node will appear. Click the Add link
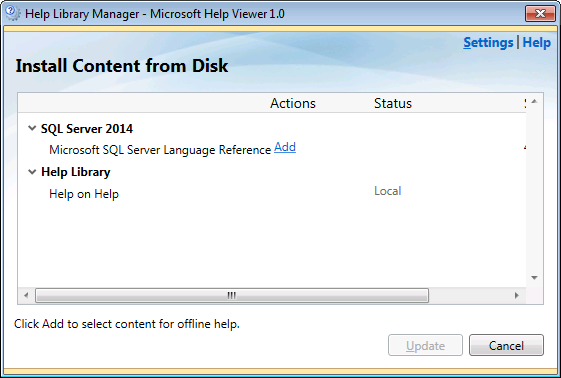
7. Click the Update button and let the installation start

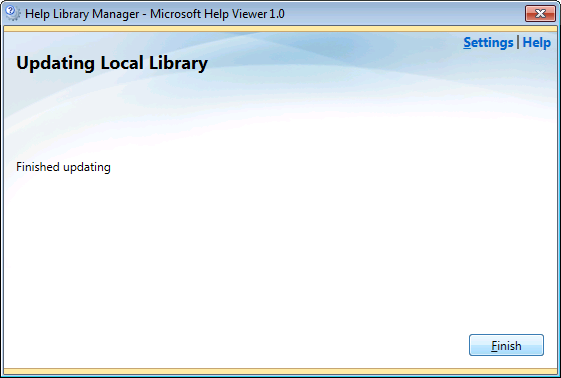
8. Installation will start and process the cab files

9. Installation finished!
9. To check whether everything is fine, click on the “remove content” link and you should see the documentation.

Done! It was easy after all, wasn’t it?
Database Free Space Monitoring – The right way
Lately I spent some time evaluating some monitoring tools for SQL Server and one thing that struck me very negatively is how none of them (to date) has been reporting database free space correctly.
I was actively evaluating one of those tools when one of my production databases ran out of space without any sort of warning.
I was so upset that I decided to code my own monitoring script.
Some things to take into account:
- Hard set limits for file growth have to be considered: a drive with lots of space is useless if the database file cannot grow and take it.
- If fixed growth is used, there must be enough space in the drive to accomodate the growth amount you set.
- If percent growth is used, you have to calculate recursively how much your database file will grow before taking all the space in the drive
- Some scripts found in blogs and books don’t account for mount points. Use
sys.dm_os_volume_statsto include mount points in your calculation (unless you’re running SQL Server versions prior to 2012). - Database free space alone is not enough. NTFS performance start degrading when the drive free space drops below 20%. Make sure you’re monitoring that as well.
- 20% of a huge database can be lots of space. You can change that threshold to whatever you find appropriate (for instance, less than 20% AND less than 20 GB)
That said, here is my script, I hope you find it useful.
-- create a temporary table to hold data from sys.master_files
IF OBJECT_ID('tempdb..#masterfiles') IS NOT NULL
    DROP TABLE #masterfiles;

CREATE TABLE #masterfiles (
    database_id int,
    type_desc varchar(10),
    name sysname,
    physical_name varchar(255),
    size_mb int,
    max_size_mb int,
    growth int,
    is_percent_growth bit,
    data_space_id int,
    data_space_name nvarchar(128) NULL,
    drive nvarchar(512),
    mbfree int
);

-- extract file information from sys.master_files
-- and correlate each file to its logical volume
INSERT INTO #masterfiles
SELECT
     mf.database_id
    ,type_desc
    ,name
    ,physical_name
    ,size_mb = size / 128
    ,max_size_mb =
        CASE
            WHEN max_size = 268435456 AND type_desc = 'LOG' THEN -1
            ELSE
                CASE
                    WHEN max_size = -1 THEN -1
                    ELSE max_size / 128
                END
        END
    ,mf.growth
    ,mf.is_percent_growth
    ,mf.data_space_id
    ,NULL
    ,d.volume_mount_point
    ,d.available_bytes / 1024 / 1024
FROM sys.master_files AS mf
CROSS APPLY sys.dm_os_volume_stats(database_id, file_id) AS d;

-- add an "emptyspace" column to hold empty space for each file
ALTER TABLE #masterfiles ADD emptyspace_mb int NULL;

-- iterate through all databases to calculate empty space for its files
DECLARE @name sysname;

DECLARE c CURSOR FORWARD_ONLY READ_ONLY STATIC LOCAL
FOR
SELECT name
FROM sys.databases
WHERE state_desc = 'ONLINE'

OPEN c
FETCH NEXT FROM c INTO @name

WHILE @@FETCH_STATUS = 0
BEGIN

    DECLARE @sql nvarchar(max)
    DECLARE @statement nvarchar(max)
    SET @sql = '
        UPDATE mf
        SET emptyspace_mb = size_mb - FILEPROPERTY(name,''SpaceUsed'') / 128,
            data_space_name =
                ISNULL(
                    (SELECT name FROM sys.data_spaces WHERE data_space_id = mf.data_space_id),
                    ''LOG''
                )
        FROM #masterfiles AS mf
        WHERE database_id = DB_ID();
    '
    SET @statement = 'EXEC ' + QUOTENAME(@name) + '.sys.sp_executesql @sql'
    EXEC sp_executesql @statement, N'@sql nvarchar(max)', @sql

    FETCH NEXT FROM c INTO @name
END

CLOSE c
DEALLOCATE c

-- create a scalar function to simulate the growth of the database in the drive's available space
IF OBJECT_ID('tempdb..calculateAvailableSpace') IS NOT NULL
    EXEC tempdb.sys.sp_executesql N'DROP FUNCTION calculateAvailableSpace'

EXEC tempdb.sys.sp_executesql N'
CREATE FUNCTION calculateAvailableSpace(
    @diskFreeSpaceMB float,
    @currentSizeMB float,
    @growth float,
    @is_percent_growth bit
)
RETURNS int
AS
BEGIN
    IF @currentSizeMB = 0
        SET @currentSizeMB = 1
    DECLARE @returnValue int = 0
    IF @is_percent_growth = 0
    BEGIN
        SET @returnValue = (@growth /128) * CAST((@diskFreeSpaceMB / (ISNULL(NULLIF(@growth,0),1) / 128)) AS int)
    END
    ELSE
    BEGIN
        DECLARE @prevsize AS float = 0
        DECLARE @calcsize AS float = @currentSizeMB
        WHILE @calcsize < @diskFreeSpaceMB
        BEGIN
            SET @prevsize = @calcsize
            SET @calcsize = @calcsize + @calcsize * @growth / 100.0
        END
        SET @returnValue = @prevsize - @currentSizeMB
        IF @returnValue < 0
            SET @returnValue = 0
    END

    RETURN @returnValue
END
'

-- report database filegroups with less than 20% available space
;WITH masterfiles AS (
    SELECT *
        ,available_space =
            CASE mf.max_size_mb
                WHEN -1 THEN tempdb.dbo.calculateAvailableSpace(mbfree, size_mb, growth, is_percent_growth)
                ELSE max_size_mb - size_mb
            END
            + emptyspace_mb
    FROM #masterfiles AS mf
),
spaces AS (
    SELECT
         DB_NAME(database_id) AS database_name
        ,data_space_name
        ,type_desc
        ,SUM(size_mb) AS size_mb
        ,SUM(available_space) AS available_space_mb
        ,SUM(available_space) * 100 /
            CASE SUM(size_mb)
                WHEN 0 THEN 1
                ELSE SUM(size_mb)
            END AS available_space_percent
    FROM masterfiles
    GROUP BY DB_NAME(database_id)
        ,data_space_name
        ,type_desc
)
SELECT *
FROM spaces
WHERE available_space_percent < 20
ORDER BY available_space_percent ASC

IF OBJECT_ID('tempdb..#masterfiles') IS NOT NULL
    DROP TABLE #masterfiles;

IF OBJECT_ID('tempdb..calculateAvailableSpace') IS NOT NULL
    EXEC tempdb.sys.sp_executesql N'DROP FUNCTION calculateAvailableSpace'
I am sure that there are smarter scripts around that calculate it correctly and I am also sure that there are other ways to obtain the same results (PowerShell, to name one). The important thing is that your script takes every important aspect into account and warns you immediately when the database space drops below your threshold, not when the available space is over.
Last time it happened to me it was a late saturday night and, while I really love my job, I can come up with many better ways to spend my saturday night.
I'm pretty sure you do as well.
Announcing ExtendedTSQLCollector
I haven’t been blogging much lately, actually I haven’t been blogging at all in the last 4 months. The reason behind is I have been putting all my efforts in a new project I started recently, which absorbed all my attention and spare time.
I am proud to announce that my project is now live and available to everyone for download.
 The project name is ExtendedTSQLCollector and you can find it at http://extendedtsqlcollector.codeplex.com. As you may have already guessed, it’s a bridge between two technologies that were not meant to work together, that could instead bring great advantages when combined: Extended Events and Data Collector.
ExtendedTSQLCollector is a set of two Collector Types built to overcome some of the limitations found in the built-in collector types and extend their functionality to include the ability to collect data from XE sessions.
The first Collector Type is the “Extended T-SQL Query” collector type, which was my initial goal when I started the project. If you have had the chance to play with the built-in “Generic T-SQL Query” collector type, you may have noticed that not all datatypes are supported. For instance, it’s impossible to collect data from XML or varchar(max) columns. This is due to the intermediate format used by this collector type: the SSIS raw files.
The “Extended T-SQL Query” collector type uses a different intermediate format, which allows collecting data of any data type. This is particularly useful, because SQL Server exposes lots of information in XML format (just think of the execution plans!) and you no longer need to code custom SSIS packages to collect that data.
The second Collector Type is the “Extended XE Reader” collector type, which takes advantage of the Extended Events streaming APIs to collect data from an Extended Events session, without the need to specify additional targets such as .xel files or ring buffers. This means no file system bloat due to .xel rollover files and no memory consumption for additional ring buffers: all the events are read directly from the session and processed in near real-time.
In addition to the filter predicates defined in the XE session, you can add more filter predicates on the data to collect and upload to the MDW and decide which columns (fields and actions) to collect. The collector will take care of creating the target table in your MDW database and upload all the data that satisfies the filter predicates.
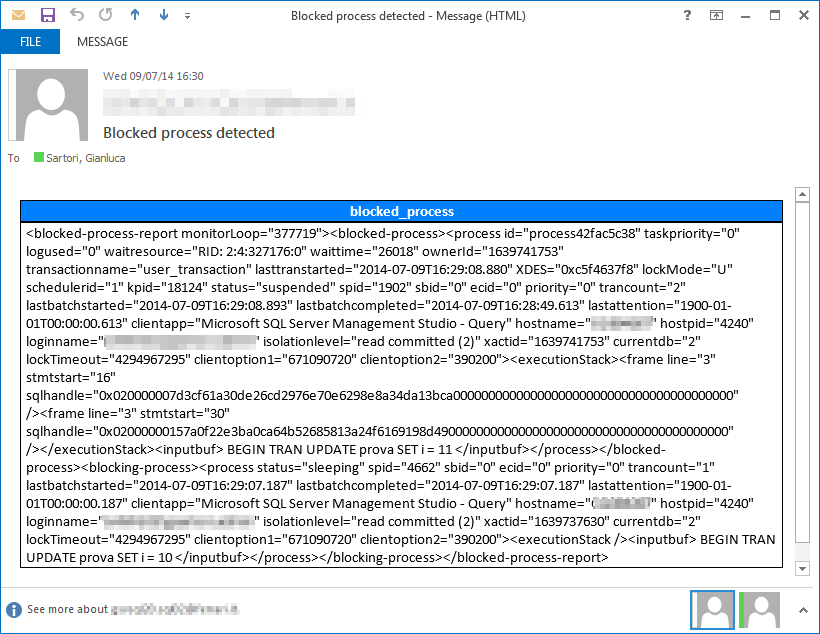
The near real-time behavior of this collector type allowed me to include an additional feature to the mix: the ability to fire alerts in response to Extended Events. The current release (1.5) allows firing email alerts when the events are captured, with additional filter predicates and the ability to include event fields and actions in the email body. You can find more information on XE alerts in the documentation.
Here is an example of the email alerts generated by the XEReader collector type for the blocked_process event:
Another part of the project is the CollectionSet Manager, a GUI to install the collector types to the target servers and configure collection sets and collection items. I think that one of the reasons why the Data Collector is very underutilized by DBAs is the lack of a Graphical UI. Besides the features specific to the ExtendedTSQLCollector, such as installing the collector type, this small utility aims at providing the features missing in the SSMS Data Collector UI. This part of the project is still at an early stage, but I am planning to release it in the next few months.
My journey through the ins and outs of the Data Collector allowed me to understand deeply how it works and how to set it up and troubleshoot it. Now I am planning to start a blog series on this topic, from the basics to the advanced features. Stay tuned 🙂
I don’t want to go into deep details on the setup and configuration of this small project: I just wanted to ignite your curiosity and make you rush to codeplex to download your copy of ExtendedTSQLCollector.
What are you waiting for?
Non-unique indexes that COULD be unique
In my last post I showed a query to identify non-unique indexes that should be unique.
You maybe have some other indexes that could be unique based on the data they contain, but are not.
To find out, you just need to query each of those indexes and group by the whole key, filtering out those that have duplicate values. It may look like an overwhelming amount of work, but the good news is I have a script for that:
DECLARE @sql nvarchar(max);

WITH indexes AS (
    SELECT
         QUOTENAME(OBJECT_SCHEMA_NAME(uq.object_id)) AS [schema_name]
        ,QUOTENAME(OBJECT_NAME(uq.object_id)) AS table_name
        ,uq.name AS index_name
        ,cols.name AS cols
    FROM sys.indexes AS uq
    CROSS APPLY (
        SELECT STUFF((
            SELECT ',' + QUOTENAME(sc.name) AS [text()]
            FROM sys.index_columns AS uc
            INNER JOIN sys.columns AS sc
                ON  uc.column_id = sc.column_id
                AND uc.object_id = sc.object_id
            WHERE uc.object_id = uq.object_id
                AND uc.index_id = uq.index_id
                AND uc.is_included_column = 0
            FOR XML PATH('')
        ),1,1,SPACE(0))
    ) AS cols (name)
    WHERE is_unique = 0
        AND has_filter = 0
        AND is_hypothetical = 0
        AND type IN (1,2)
        AND object_id IN (
            SELECT object_id
            FROM sys.objects
            WHERE is_ms_shipped = 0
            AND type = 'U'
        )
)
-- Build a big statement to query index data
SELECT @sql = (
    SELECT
        'SELECT ''' + [schema_name] + ''' AS [schema_name],
            ''' + table_name + ''' AS table_name,
            ''' + index_name + ''' AS index_name,
            can_be_unique =
                CASE WHEN (
                    SELECT COUNT(*)
                    FROM (
                        SELECT ' + cols + ',COUNT(*) AS cnt
                        FROM ' + [schema_name] + '.' + [table_name] + '
                        GROUP BY ' + cols + '
                        HAVING COUNT(*) > 1
                    ) AS data
                    ) > 0
                THEN 0
                ELSE 1
                END;'
    FROM indexes
    FOR XML PATH(''), TYPE
).value('.','nvarchar(max)');

-- prepare a table to receive results
DECLARE @results TABLE (
    [schema_name] sysname,
    [table_name] sysname,
    [index_name] sysname,
    [can_be_unique] bit
)

-- execute the script and pipe the results
INSERT @results
EXEC(@sql)

-- show candidate unique indexes
SELECT *
FROM @results
WHERE can_be_unique = 1
ORDER BY [schema_name], [table_name], [index_name]
The script should complete quite quickly, since you have convenient indexes in place. However, I suggest that you run it against a non production copy of your database, as it will scan all non unique indexes found in the database.
The results will include all the indexes that don’t contain duplicate data. Whether you should make those indexes UNIQUE, only you can tell.
Some indexes may contain unique data unintentionally, but could definitely store duplicate data in the future. If you know your data domain, you will be able to spot the difference.
