Blog Archives
Benchmarking with WorkloadTools
If you ever tried to capture a benchmark on your SQL Server, you probably know that it is a complex operation. Not an impossible task, but definitely something that needs to be planned, timed and studied very thoroughly.
The main idea is that you capture a workload from production, you extract some performance information, then you replay the same workload to one or more environments that you want to put to test, while capturing the same performance information. At the end of the process, you can compare performance under different conditions, identify regressions, avoid unwanted situations and rate your tuning efforts.
A big part of the complexity, let’s face it, comes from the fact that the tools that we have had in our toolbelt so far are complex and suffer from a number of limitations that make this exercise very similar to a hurdle race.
If you want to replay a workload from production to test, you need to be able to capture the workload first. Even before you start, you’re already confronted with a myriad of questions:
- What do you use for this? A server-side trace? Extended events? Profiler maybe?
- Which events do you capture? Which fields?
- How long do you need to run the capture? How much is enough? One hour? One day? One week? One month?
- Can you apply some filters?
- Will you have enough disk space to store the captured data?
Throughout the years, you’ve had multiple tools for capturing workloads, each with its own strengths and limitations:
- Profiler
- GOOD: extremely easy to use
- BAD: non-negligible impact on the server
- Extended Events
- GOOD: lightweight
- BAD: not compatible with older versions of SQLServer
- SQL Trace
- GOOD: less impactful than profiler
- BAD: deprecated
However, capturing the workload is not enough: you need to be able to replay it and analyze/compare the performance data.
But fear not! You have some tools that can help you here:
- RML Utilities
- SQL Nexus
- Distributed Replay
- Database Experimentation Assistant (DEA)
The bad news is that (again) each of these tools has its limitations and hurdles, even if the tin says that any monkey could do it. There is nothing like running ReadTrace.exe or Dreplay.exe against a huge set of trace files, only to have it fail after two hours, without a meaningful error message (true story). Moreover, of all these tools, only Distributed Replay (and DEA, which is built on top of it) support Azure SqlDatabase and Azure Managed instances: if you’re working with Azure, be prepared to forget everything you know about traces and RML Utilities.
Introducing WorkloadTools
Throughout my career, I had to go through the pain of benchmarking often enough to get fed up with all the existing tools and decide to code my own. The result of this endeavor is WorkloadTools: a collection of tools to collect, analyze and replay SQL Server workloads, on premises and in the cloud.
At the moment, the project includes 3 tools:
- SqlWorkload – a command line tool to capture, replay and analyze a workload
- ConvertWorkload – a command line tool to convert existing workloads (traces and extended events) to the format used by SqlWorkload
- WorkloadViewer – a GUI tool to visualize and analyze workload data
SqlWorkload is different from the traditional tools, because it lets you choose the technology for the capture: SqlTrace, Extended Events or a pre-recorded workload file. SqlWorkload also lets you choose the platform that you prefer: it works with older versions of SqlServer (tested from 2008 onwards, but nothing prevents it from running on SqlServer 2000) and newer versions, like 2017 or 2019. But the groundbreaking feature of SqlWorkload is its ability to work with Azure Sql Database Managed Instances and Azure Sql Database, by capturing Extended Events on Azure blob storage.
The capture is performed by a “Listener”, that reads the workload events from the source and forwards them immediately to a collection of “Consumers”, each specialized for performing a particular task on the events that it receives. You have a consumer for replaying the workload, a consumer for saving the workload to a file and a consumer for analyzing the workload to a database.
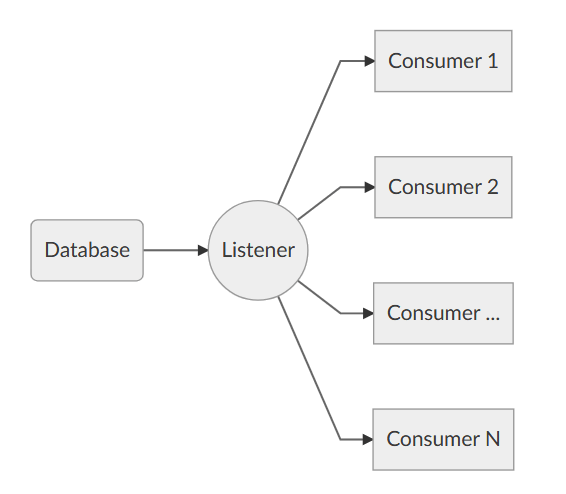
This flexible architecture allows you to do things differently from the existing tools. The traditional approach to benchmarking has always been:
- capture to one or more files
- analyze the files
- replay and capture
- analyze the files
- compare
SqlWorkload does not force you to save your workload to disk completely before you can start working with it, but it lets you forward the events to any type of consumer as soon as it is captured, thus enabling new types of workflows for your benchmarking activities. With SqlWorkload you are free to analyze the events while capturing, but you can also replay to a target database in real-time, while a second instance of SqlWorkload analyzes the events on the target.

If you’re used to a more traditional approach to benchmarking, you can certainly do things the usual way: you can capture a workload to a file, then use that file as a source for both the workload analysis and the replay. While replaying, you can capture the workload to a second set of files, that you can analyze to extract performance data. Another possibility is to analyze the workload directly while you capture it, writing to a workload file that you can use only for the replay.
As you can see, you have many possibilities and you are free to choose the solution that makes sense the most in your scenario. You may think that all this flexibility comes at the price of simplicity, but you’d be surprised by how easy it is to get started with WorkloadTools. SqlWorkload was designed to be as simple as possible, without having to learn and remember countless command line switches. Instead, it can be controlled by providing parameters in .JSON files, that can be saved, kept around and used as templates for the next benchmark.
For instance, the .JSON configuration file for “SqlWorkload A” in the picture above would look like this:
{
    "Controller": {

        "Listener":
        {
            "__type": "ExtendedEventsWorkloadListener",
            "ConnectionInfo":
            {
                "ServerName": "SourceServer",
                "DatabaseName": "SourceDatabase",
                "UserName": "sa",
                "Password": "P4$$w0rd!"
            },
            "DatabaseFilter": "SourceDatabase"
        },

        "Consumers":
        [
            {
                "__type": "ReplayConsumer",
                "ConnectionInfo":
                {
                    "ServerName": "TargetServer",
                    "DatabaseName": "TargetDatabase",
                    "UserName": "sa",
                    "Password": "Pa$$w0rd!"
                }
            },
            {
                "__type": "AnalysisConsumer",
                "ConnectionInfo":
                {
                    "ServerName": "AnalysisServer",
                    "DatabaseName": "AnalysisDatabase",
                    "SchemaName": "baseline",
                    "UserName": "sa",
                    "Password": "P4$$w0rd!"
                },
                "UploadIntervalSeconds": 60
            }
        ]
    }
}
As you can see, SqlWorkload expects very basic information and does not need to set up complex traces or XE sessions: all you have to do is configure what type of Listener to use and its parameters, then you need to specify which Consumers to use and their parameters (mainly connection details and credentials) and SqlWorkload will take care of the rest.
If you need to do control the process in more detail, you can certainly do so: the full list of parameters that you can specify in .JSON files is available in the documentation of SqlWorkload at GitHub.
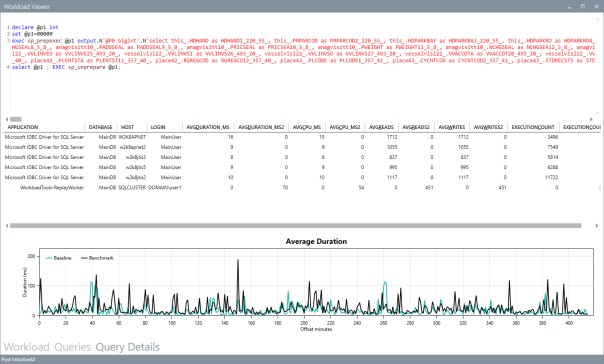
Once the capture is over and you completely persisted the workload analysis to a database, you can use WorkloadViewer to visualize it. WorkloadViewer will show you charts for Cpu, Duration and Batches/sec, comparing how the two benchmarks performed. You can also use the filters at the top to focus the analysis on a subset of the data or you can zoom and pan on the horizontal axis to select a portion of the workload to analyze.

You can also use the “Queries” tab to see an overview of the individual batches captured in the workload. For each of those batches, you’ll be able to see the text of the queries and you will see stats for cpu, duration, reads, writes and number of executions. Sorting by any of these columns will let you spot immediately the regressions between the baseline and the benchmark and you will know exactly where to start tuning.

If you double click one of the queries, you will go to the Query Details tab, which will show you additional data about the selected query, along with its performance over time:
If WorkloadViewer is not enough for you, the project also includes a PowerBI dashboard that you can use to analyze the data from every angle. Does it look exciting enough? Wait, there’s more…
If you already have a pre-captured workload in any format (SqlTrace or Extended Events) you can use the command line tool ConvertWorkload to create a new workload file in the intermediate format used and understood by SqlWorkload (spoiler: it’s a SqLite database), in order to use it as the source for a WorkloadFileListener. This means that you can feed your existing trace data to the WorkloadTools analysis database, or replay it to a test database, even if the workload was not captured with WorkloadTools in the first place.
We have barely scratched the surface of what WorkloadTools can do: in the next weeks I will post detailed information on how to perform specific tasks with WorkloadTools, like capturing to a workload file or performing a real-time replay. In the meantime, you can read the documentation or you can join me at SqlBits, where I will introduce WorkloadTools during my session.
Stay tuned!
Introducing XESmartTarget
Three years ago, I started to work on a project called ExtendedTsqlCollector. I blogged about it multiple times here on spaghettidba.com.
Even if I received positive feedback, I knew that one aspect was slowing down the adoption of the project: the Data Collector. That particular feature of SQL Server has a very bad reputation for being difficult to set up, customize and monitor. ExtendedTSQLCollector tried to address some of those issues, but the damage was already done and I knew that the Data Collector was already on the verge of extinction.
So, how could I preserve the work done for that project and, at the same time, offer DBAs the ability to set up complex actions in response to events? What I aimed to release was a tool capable of streaming events from a session and perform configurable actions in response to those events, mainly writing to a database table and sending alerts. The tool I had in mind should have to be configured in a simple and straightforward way, possibly with a single configuration file.
So, back to the drawing board. The tool I came up with had ditched the data collector, but it kept as much as possible from the previous project.
Introducing XESmartTarget
I am proud to introduce XESmartTarget: the easiest way to interact with extended events sessions without writing a single line of code.
XESmartTarget uses the Extended Events streaming API to connect to a session and execute some actions in response to each event. The actions you perform can be configured in a simple .json file, which controls the Response types and all their properties.
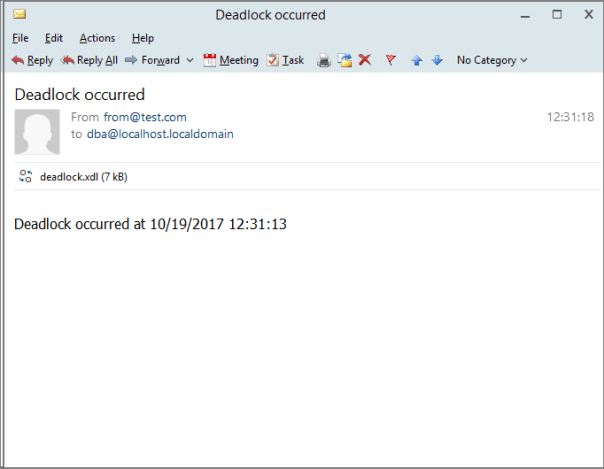
For instance, if you have a session to capture deadlocks, you may want to be notified whenever such an event is captured. All you need to do is configure XESmartTarget to send an email using the EmailResponse class. You can do that by creating a simple .json file with all the parameters needed:
| { | |
| "Target": { | |
| "ServerName": "(local)\\SQL2014", | |
| "SessionName": "deadlocks", | |
| "FailOnProcessingError": false, | |
| "Responses": [ | |
| { | |
| "__type": "EmailResponse", | |
| "SMTPServer": "localhost", | |
| "Sender": "from@test.com", | |
| "To": "dba@localhost.localdomain", | |
| "Subject": "Deadlock occurred", | |
| "Body": "Deadlock occurred at {collection_time}", | |
| "Attachment": "xml_report", | |
| "AttachmentFileName": "deadlock.xdl", | |
| "HTMLFormat": true, | |
| "Events": [ | |
| "xml_deadlock_report" | |
| ] | |
| } | |
| ] | |
| } | |
| } |
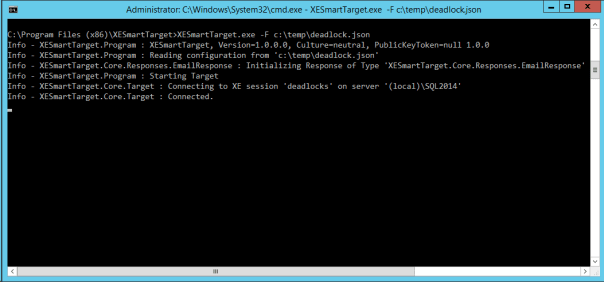
XESmartTarget will connect to your session and will execute an EmailResponse for every event you capture. What will you see? Not much, because XESmartTarget is a console application that you are supposed to run in the background:
What you will actually see is email messages flowing to your inbox:
This is just an example of what XESmartTarget can do: you already have Response types to write events to a database table or replay execution-related events to a target instance. More Response types are in the works as well, but the good news is that XESmartTarget is open source, so you can code your own ad contribute it to the project on GitHub.
What are you waiting for? Download and try XESmartTarget now!
Monitoring blocking and deadlocking with Extended T-SQL Collector
Monitoring blocking and deadlocking hasn’t always been easy. Sometimes, the tools available in SQL Server are not as friendly as we would like them to be.
Some are very useful for alerting, but don’t provide a simple way to capture additional information about the event. For instance, a simple SQLAgent alert for “deadlocks/sec > 0” is enough to shoot an email to the DBAs whenever a deadlock happens, but it doesn’t provide a simple way to capture the deadlock graph and include it in the email or save it to a destination table.
Some other methods are very useful for capturing all the information we need, but don’t provide a way to fire an alert when the event is captured. For instance, capturing blocked process reports with an Extended Events session is very easy, but firing an alert when the event is captured is not.
In this post I will show you an easy way to combine monitoring and alerting using the cutting edge monitoring technology available in SQL Server: Extended Events.
Extended Events are cool: they can capture events not available otherwise and they impact the monitored server much less than other capture technologies (e.g. SQL Trace). However, as far as alerting is concerned, they are still lacking a piece of the puzzle. In fact Extended Events don’t provide a built-in way to fire an alert whenever an event is captured. With SQL Trace we had Event Notifications that did exactly this, using a Service Broker queue.
It would be great if there was a way to capture events with an XE session, store them to a table for later analysis and alert as soon as the event occurs.
The good news is that a tool that can do that already exists and even better news is that it’s free and open source! Its name is Extended T-SQL Collector.
Extended T-SQL Collector allows you to combine Extended Events and Data Collector, with the addition of alerting for interesting events. All you have to do is download your copy of Extended T-SQL Collector, install it on your server and then set up a collection set for blocking and deadlocking.
If you ever had the chance to play with Data Collector and tried to create a custom collection set, you probably have noticed that it’s not as easy as it should. This part of the Data Collector is missing a Graphical User Interface and requires messing with XML. Nobody likes XML. If you do, be aware that you’re in a very small minority.
Creating the collection set with the GUI
With Extended T-SQL Collector you can create a collection set to capture blocked processes and deadlocks using the GUI.
Here’s how you do it:
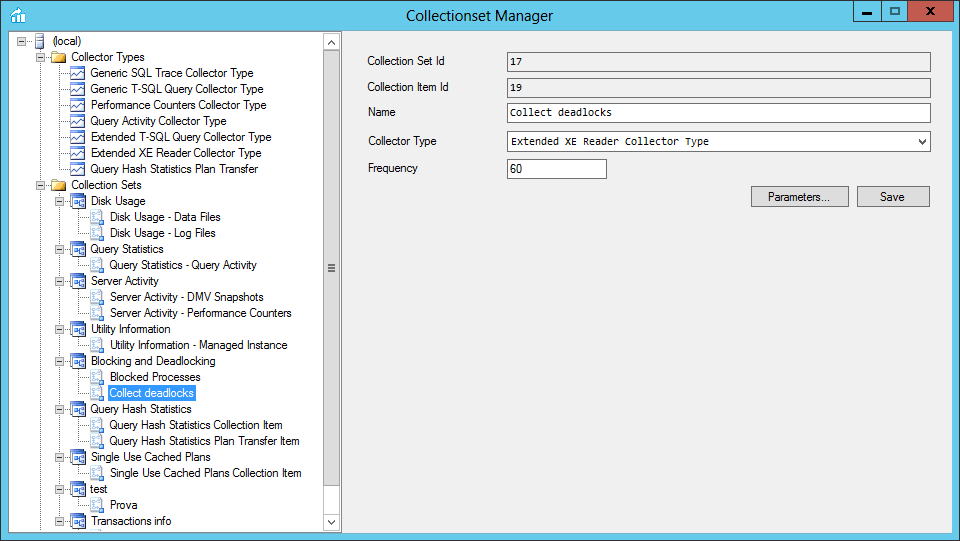
1. Start the Collectionset Manager and connect it to your instance.
2. If the custom collector types provided by Extended T-SQL Collector are not installed, install them

3. Right click the “Collection Sets” node and select “Add”

4. Fill the information about your Collection Set and hit “Save”

5. Right click the Collection Set “Blocking and Deadlocking” and select “Add”. Now enter the information for the first collection item (Blocked Processes)

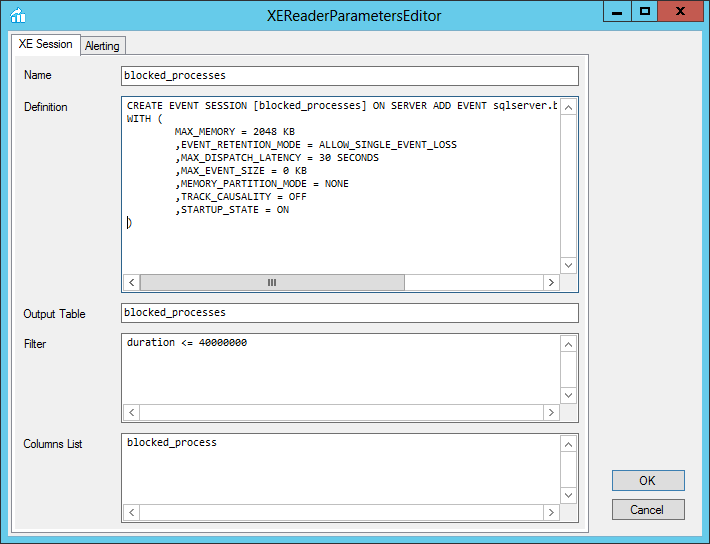
6. Click the “Parameters” button and fill the dialog with the information requested. The most important part of this step is providing a definition for the Extended Events session that captures blocked processes. This is the session I am using:
CREATE EVENT SESSION [blocked_processes] ON SERVER ADD EVENT sqlserver.blocked_process_report
WITH (
	MAX_MEMORY = 2048 KB
	,EVENT_RETENTION_MODE = ALLOW_SINGLE_EVENT_LOSS
	,MAX_DISPATCH_LATENCY = 30 SECONDS
	,MAX_EVENT_SIZE = 0 KB
	,MEMORY_PARTITION_MODE = NONE
	,TRACK_CAUSALITY = OFF
	,STARTUP_STATE = ON
)
You also have to enter values for the output table (the name of the table that will hold the data in the MDW database), an optional filter to futher limiting the rows you want to save to the database and the comma separated list of the event session fields you want to add to the destination table. In this case, the filter is “duration <= 40000000" to capture the "blocked_process" event just once, because a new event will be fired each time the configuration option "blocked_process_threshold" and its multiples are exceeded.
7. Now click the “Alerting” tab and enter the information needed to fire an email every time an event is captured. Extended T-SQL Collector uses Database Mail, so make sure you have a profile that you can use for this purpose. Now hit OK to close this dialog and hit “Save” in the main window.

8. Now you need a collection item to collect deadlocks. Right click the collection set on the tree on the left and click “Add”. Now fill the information as you did for the collection item for blocked processes and hit “Save”
9. Hit “Parameters” and provide all the information needed for the collection item. Again, you need a session definition:
CREATE EVENT SESSION [deadlocks] ON SERVER
ADD EVENT sqlserver.xml_deadlock_report
WITH (
	MAX_MEMORY = 2048 KB
	,EVENT_RETENTION_MODE = ALLOW_SINGLE_EVENT_LOSS
	,MAX_DISPATCH_LATENCY = 30 SECONDS
	,MAX_EVENT_SIZE = 0 KB
	,MEMORY_PARTITION_MODE = NONE
	,TRACK_CAUSALITY = OFF
	,STARTUP_STATE = ON
)
Enter information for Output Table and Columns list as well.

10. Click the “Alerting” tab and fill the information for the email setup.

11. Now just hit OK to close the dialog and save in the main window.
12. Hit “Start” in the collection set window to start the collection set.
Creating the collection set with a script
Too complicated? Don’t worry, you can permform the same exact process using a script:
-- Enable editing advanced configuration options
EXEC sp_configure 'advanced', 1
RECONFIGURE
GO
-- Set the blocked process threshold
EXEC sp_configure 'blocked process threshold (s)', 20
RECONFIGURE
GO
BEGIN TRANSACTION
BEGIN TRY
DECLARE @collection_set_id_1 int
DECLARE @collection_set_uid_2 uniqueidentifier
EXEC [msdb].[dbo].[sp_syscollector_create_collection_set]
@name=N'Blocking and Deadlocking',
@collection_mode=0,
@description=N'Collects Blocked Process Reports and Deadlocks using Extended Events',
@logging_level=1,
@days_until_expiration=30,
@schedule_name=N'CollectorSchedule_Every_5min',
@collection_set_id=@collection_set_id_1 OUTPUT,
@collection_set_uid= '19AE101D-B30F-4447-8233-1314AEF0A02F'
DECLARE @collector_type_uid_3 uniqueidentifier
SELECT @collector_type_uid_3 = collector_type_uid
FROM [msdb].[dbo].[syscollector_collector_types]
WHERE name = N'Extended XE Reader Collector Type';
DECLARE @collection_item_id_4 int
EXEC [msdb].[dbo].[sp_syscollector_create_collection_item]
@name=N'Blocked Processes',
@parameters=N'
<ns:ExtendedXEReaderCollector xmlns:ns="DataCollectorType">
<Session>
<Name>blocked_processes</Name>
<OutputTable>blocked_processes</OutputTable>
<Definition>
CREATE EVENT SESSION [blocked_processes] ON SERVER ADD EVENT sqlserver.blocked_process_report
WITH (
MAX_MEMORY = 2048 KB
,EVENT_RETENTION_MODE = ALLOW_SINGLE_EVENT_LOSS
,MAX_DISPATCH_LATENCY = 30 SECONDS
,MAX_EVENT_SIZE = 0 KB
,MEMORY_PARTITION_MODE = NONE
,TRACK_CAUSALITY = OFF
,STARTUP_STATE = ON
)
</Definition>
<Filter>duration <= 40000000</Filter>
<ColumnsList>blocked_process</ColumnsList>
</Session>
<Alert Enabled="true" WriteToERRORLOG="false" WriteToWindowsLog="false">
<Sender>MailProfile</Sender>
<Recipient>dba@localhost.localdomain</Recipient>
<Subject>Blocked process detected</Subject>
<Importance>High</Importance>
<ColumnsList>blocked_process</ColumnsList>
<Filter>duration <= 40000000</Filter>
<Mode>Atomic</Mode>
<Delay>60</Delay>
</Alert>
</ns:ExtendedXEReaderCollector>',
@collection_item_id=@collection_item_id_4 OUTPUT,
@frequency=60,
@collection_set_id=@collection_set_id_1,
@collector_type_uid=@collector_type_uid_3
Declare @collection_item_id_6 int
EXEC [msdb].[dbo].[sp_syscollector_create_collection_item] @name=N'Collect deadlocks', @parameters=N'
<ns:ExtendedXEReaderCollector xmlns:ns="DataCollectorType">
<Session>
<Name>deadlocks</Name>
<OutputTable>deadlocks</OutputTable>
<Definition>
CREATE EVENT SESSION [deadlocks] ON SERVER
ADD EVENT sqlserver.xml_deadlock_report
WITH (
MAX_MEMORY = 2048 KB
,EVENT_RETENTION_MODE = ALLOW_SINGLE_EVENT_LOSS
,MAX_DISPATCH_LATENCY = 30 SECONDS
,MAX_EVENT_SIZE = 0 KB
,MEMORY_PARTITION_MODE = NONE
,TRACK_CAUSALITY = OFF
,STARTUP_STATE = ON
)
</Definition>
<ColumnsList>xml_report</ColumnsList>
</Session>
<Alert Enabled="true" WriteToERRORLOG="false" WriteToWindowsLog="false">
<Sender>MailProfile</Sender>
<Recipient>dba@localhost.localdomain</Recipient>
<Subject>Deadlock detected</Subject>
<Importance>High</Importance>
<ColumnsList>xml_report</ColumnsList>
<Mode>Atomic</Mode>
<Delay>60</Delay>
</Alert>
</ns:ExtendedXEReaderCollector>',
@collection_item_id=@collection_item_id_6 OUTPUT,
@frequency=60,
@collection_set_id=@collection_set_id_1,
@collector_type_uid=@collector_type_uid_3
COMMIT TRANSACTION;
END TRY
BEGIN CATCH
ROLLBACK TRANSACTION;
DECLARE @ErrorMessage NVARCHAR(4000);
DECLARE @ErrorSeverity INT;
DECLARE @ErrorState INT;
DECLARE @ErrorNumber INT;
DECLARE @ErrorLine INT;
DECLARE @ErrorProcedure NVARCHAR(200);
SELECT @ErrorLine = ERROR_LINE(),
@ErrorSeverity = ERROR_SEVERITY(),
@ErrorState = ERROR_STATE(),
@ErrorNumber = ERROR_NUMBER(),
@ErrorMessage = ERROR_MESSAGE(),
@ErrorProcedure = ISNULL(ERROR_PROCEDURE(), '-');
RAISERROR (14684, @ErrorSeverity, 1 , @ErrorNumber, @ErrorSeverity, @ErrorState, @ErrorProcedure, @ErrorLine, @ErrorMessage);
END CATCH;
GO
Getting Alerts
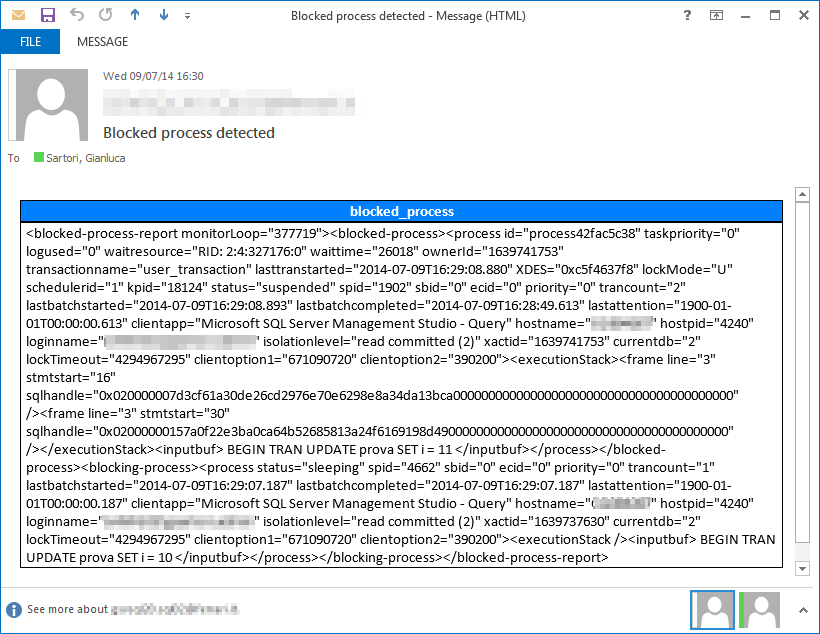
Now that your session is running, you can be notified via email whenever blocking or deadlocking occurs.
This is a sample of the email you will receive, containing the colums you selected in the setup.

You can also use the Collectionset Manager UI to query the information captured from the MDW database. You just need to right click a collection item and select “Query” from the context menu. Select a table from the dropdown and adjust the date/time range with the sliders:

Bottom line
Extended T-SQL Collector makes monitoring and alerting easy. It uses Extended Events to capture information from your server and alert you when problematic events arise.
Go download your copy! What are you waiting for?
Announcing ExtendedTSQLCollector
I haven’t been blogging much lately, actually I haven’t been blogging at all in the last 4 months. The reason behind is I have been putting all my efforts in a new project I started recently, which absorbed all my attention and spare time.
I am proud to announce that my project is now live and available to everyone for download.
 The project name is ExtendedTSQLCollector and you can find it at http://extendedtsqlcollector.codeplex.com. As you may have already guessed, it’s a bridge between two technologies that were not meant to work together, that could instead bring great advantages when combined: Extended Events and Data Collector.
ExtendedTSQLCollector is a set of two Collector Types built to overcome some of the limitations found in the built-in collector types and extend their functionality to include the ability to collect data from XE sessions.
The first Collector Type is the “Extended T-SQL Query” collector type, which was my initial goal when I started the project. If you have had the chance to play with the built-in “Generic T-SQL Query” collector type, you may have noticed that not all datatypes are supported. For instance, it’s impossible to collect data from XML or varchar(max) columns. This is due to the intermediate format used by this collector type: the SSIS raw files.
The “Extended T-SQL Query” collector type uses a different intermediate format, which allows collecting data of any data type. This is particularly useful, because SQL Server exposes lots of information in XML format (just think of the execution plans!) and you no longer need to code custom SSIS packages to collect that data.
The second Collector Type is the “Extended XE Reader” collector type, which takes advantage of the Extended Events streaming APIs to collect data from an Extended Events session, without the need to specify additional targets such as .xel files or ring buffers. This means no file system bloat due to .xel rollover files and no memory consumption for additional ring buffers: all the events are read directly from the session and processed in near real-time.
In addition to the filter predicates defined in the XE session, you can add more filter predicates on the data to collect and upload to the MDW and decide which columns (fields and actions) to collect. The collector will take care of creating the target table in your MDW database and upload all the data that satisfies the filter predicates.
The near real-time behavior of this collector type allowed me to include an additional feature to the mix: the ability to fire alerts in response to Extended Events. The current release (1.5) allows firing email alerts when the events are captured, with additional filter predicates and the ability to include event fields and actions in the email body. You can find more information on XE alerts in the documentation.
Here is an example of the email alerts generated by the XEReader collector type for the blocked_process event:
Another part of the project is the CollectionSet Manager, a GUI to install the collector types to the target servers and configure collection sets and collection items. I think that one of the reasons why the Data Collector is very underutilized by DBAs is the lack of a Graphical UI. Besides the features specific to the ExtendedTSQLCollector, such as installing the collector type, this small utility aims at providing the features missing in the SSMS Data Collector UI. This part of the project is still at an early stage, but I am planning to release it in the next few months.
My journey through the ins and outs of the Data Collector allowed me to understand deeply how it works and how to set it up and troubleshoot it. Now I am planning to start a blog series on this topic, from the basics to the advanced features. Stay tuned 🙂
I don’t want to go into deep details on the setup and configuration of this small project: I just wanted to ignite your curiosity and make you rush to codeplex to download your copy of ExtendedTSQLCollector.
What are you waiting for?
Ten features you had in Profiler that are missing in Extended Events
Oooooops!

I exchanged some emails about my post with Jonathan Kehayias and looks like I was wrong on many of the points I made.
I don’t want to keep misleading information around and I definitely need to fix my wrong assumptions.
Unfortunately, I don’t have the time to correct it immediately and I’m afraid it will have to remain like this for a while.
Sorry for the inconvenience, I promise I will try to fix it in the next few days.
