Recipe 2: Writing Extended Events to a table
Welcome to the second recipe of this Extended Events cookbook! You will find the first blog post of the series here and you can browse all recipes with the xesmarttarget tag on this blog.
The problem
This time, you want capture all the queries executing on your server and save the Extended Events data to a table in SQL Server. One of the things you cannot achieve easily with the standard targets in Extended Events is writing to a database table. If you check the documentation and all the blogs that you find on the Internet, all of them recommend using two possible methods to extract the information from the session:
- Shredding the XML of the session data from the ring buffer target
- Using
master.sys.fn_xe_file_target_read_fileto read the session data from a file target
The first approach is extremely painful (XML shredding – enough said).
The second approach requires a file target, which is not always available. It also requires to stop the session to read all the data, or write extremely complicated code to read the data incrementally while the session is running (believe me, I did it and my brain still hurts).
This is where XESmartTarget jumps in to help you! All you have to do is write some configuration in a json file and let XESmartTarget do its magic.
For this task you can use a TableAppenderResponse, that takes care of reading all the events from the session using the streaming API and write them to a target table, that can also be created automatically by XESmartTarget itself.
The session
This time you can use a plain SQL script to create the session. It is going to capture rpc_completed and sql_batch_completed events, the same in a Profiler Standard trace.
Remember that you don’t need to set up any targets, it’s enough to add the events and start the session, like this:
IF NOT EXISTS ( SELECT * FROM sys.server_event_sessions WHERE name = 'Recipe02')

CREATE EVENT SESSION [Recipe02] ON SERVER
ADD EVENT sqlserver.rpc_completed(
    ACTION(
        package0.event_sequence,
        sqlserver.client_app_name,
        sqlserver.client_pid,
        sqlserver.database_name,
        sqlserver.nt_username,
        sqlserver.query_hash,
        sqlserver.server_principal_name,
        sqlserver.session_id
    )
    WHERE ([package0].[equal_boolean]([sqlserver].[is_system],(0)))
),
ADD EVENT sqlserver.sql_batch_completed(
    ACTION(
        package0.event_sequence,
        sqlserver.client_app_name,
        sqlserver.client_pid,
        sqlserver.database_name,
        sqlserver.nt_username,
        sqlserver.query_hash,
        sqlserver.server_principal_name,
        sqlserver.session_id
    )
    WHERE ([package0].[equal_boolean]([sqlserver].[is_system],(0)))
)
GO

IF NOT EXISTS ( SELECT * FROM sys.dm_xe_sessions WHERE name = 'Recipe02')
    ALTER EVENT SESSION Recipe02 ON SERVER STATE = START;
XESmartTarget
Now that the session is set up, you can use XESmartTarget to process the data. As you learned in the previous recipe, all you have to do is create a JSON file with configuration data, according to what the documentation says. This time, the JSON file looks like this:
{
    "Target": {
        "ServerName": "$ServerName",
        "SessionName": "Recipe02",
        "FailOnProcessingError": false,
        "Responses": [
            {
                "__type": "TableAppenderResponse",
                "ServerName": "$ServerName",
                "DatabaseName": "XERecipes",
                "TableName": "Recipe_02_Queries",
                "AutoCreateTargetTable": false,
                "OutputColumns": [
                    "name",
                    "collection_time",
                    "client_app_name",
                    "server_principal_name",
                    "database_name",
                    "batch_text",
                    "statement"
                ],
                "Events": [
                    "rpc_completed",
                    "sql_batch_completed"
                ]
            }
        ]
    }
}
It is very similar to the one we had for CsvAppenderResponse, but there are some interesting things to note.
First, you will notice that we have some placeholders that start with the dollar sign, like $ServerName. Those are Global Variables, that allow you to reuse the same JSON file in multiple situations. You can provide the values for the Global variables from the command line of XESmartTarget, in the form –GlobalVariables key1=value1 key2=value2 … keyN=valueN
In this example, you don’t have to create a new JSON file for every server that you connect to, but you can reuse the same file, by specifying the name of the server in the Global Variables.
Another thing worth noting is the AutoCreateTable property: it controls whether XESmartTarget will attempt to create the target table based on the columns specified in the OutputColumns property. XESmartTarget will try to guess the correct data types, but it will have no way to determine the maximum length for string columns, so they will be created as nvarchar(max). If you want a more precise data type definition, I suggest that you create the table manually and set this property to false.
There is another property that controls the behaviour of the TableAppenderResponse, even if it does not appear in the configuration file above. UploadIntervalSeconds controls how often XESmartTarget uploads the data to the target table. The default is 10 seconds: if you’re ok with that, you can omit it in the configuration file, otherwise you’re free to set it to a different value. Between uploads, the data is held in memory, so make sure to reduce this interval when you have a lot of events captured by your session.
Save the JSON file as c:\temp\Recipe_02_Output_Table.json and you’re ready to invoke XESmartTarget. This time, the command line will need the server’s name specified as a Global Variable:
"%ProgramFiles%\XESmartTarget\xesmarttarget.exe" --File c:\temp\Recipe_02_Output_Table.json --GlobalVariables ServerName=(local)\SQLEXPRESS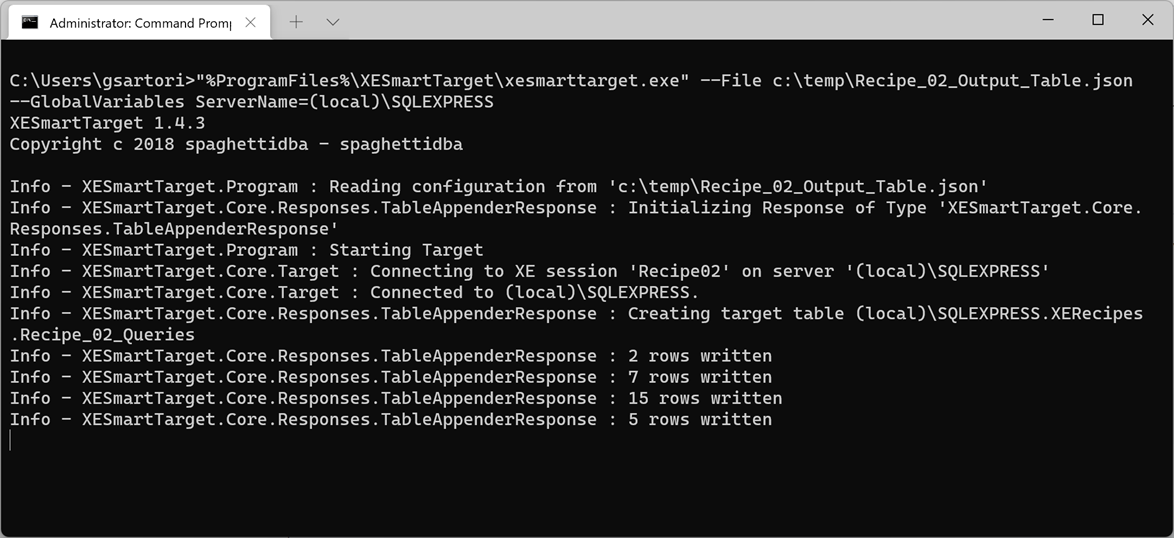
The output will tell you when the target table has been created and will count the rows written by each upload. Let’s check the data in the database with a quick query:

How cool! The table has been created and the data is being written to it every 10 seconds. That’s one thing that is not easy to achieve with the built-in targets!
Recap
You wanted to save all the commands executed on your SQL Server to a table in your database, so you configured XESmartTarget using the TableAppenderResponse. That was super easy, wasn’t it?
In the next recipe you will learn how to manipulate the output further, using expression columns and event filters. Stay tuned!
Recipe 1: Writing Extended Events to a CSV file
Welcome to the first recipe of this Extended Events cookbook! You will find the first blog post of the series here and you can browse all recipes with the xesmarttarget tag on this blog.
Recipes: what are the ingredients?
Every recipe starts with a problem to solve and has three ingredients:
- A session to capture the events
- A JSON configuration file for XESmartTarget to process the events
- A client application to read the data produced by XESmartTarget
The problem
In this case, imagine that you wanted to observe the commands executed on a SQL Server instance and save them to a file to process them later. Of course, Extended Events can do that with the built-in targets. However, when you write to a file target, the file has to reside on the disks of the SQL Server machine (well, actually, the file could be sitting on a file share writable by SQL Server or even on BLOB storage on Azure, but let’s keep it simple). How do you use the storage of the client machine instead of using the precious filesystem of the server machine?
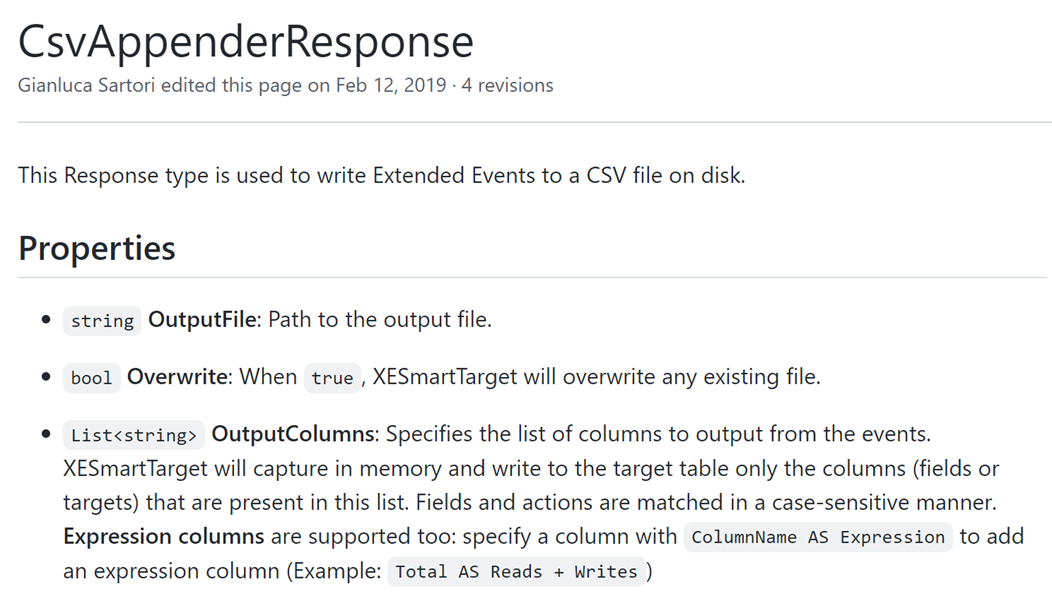
Here is where XESmartTarget can help you with a CsvAppenderResponse. This Response type writes all the events it receives to a CSV file, that can be saved on the client machine, without wasting disk space on the server. You can decide which events to process and which columns to include in the CSV file, but more on that later.
The session
First of all, you need a session: how do you create it? I know what you’re thinking: “if this was a trace, I would know how to get it”. Right. Many DBAs are still using Traces, because Extended Events have not been very friendly to them. Profiler was super easy to use: start the program, connect, select a template, choose events and columns, start the trace and you see the data right away in the GUI. Extended Events can be a bit overwhelming because there are multiple concepts to get hold of: sessions, events, targets, fields, actions… Yeah, it’s the same old story: more power, more responsibility.
It was not just you: everyone was confused by Extended Events when it first shipped with SQL Server 2012 (well, we had something in 2008, but it wasn’t really a replacement for traces until 2012).
Chrissy LeMaire was just as confused as you, so she did what the giants do: she studied the topic in depth and not only she made it easier for herself, but she made it easier for everyone using dbatools. If you don’t know what dbatools is, you really need to check it out: it’s a Powershell module that allows DBAs to perform all their day-to-day tasks on SQL Servers using powershell. Everything you can do with SSMS (and much more!) can be done with dbatools. Chrissy created a lot of dbatools commands to work with Extended Events and now everything is much easier!
But is it really as easy as working with traces? With Profiler, you would have the Standard template and you would only need to click start. Can it be that simple with dbatools? Let’s find out.
One of the great features that Chrissy added to dbatools is the ability to create a session from a template. She gathered a lot of useful session definitions from community blog posts, scripts, and templates from Microsoft tools, then she included those definitions in dbatools. It’s the same as in Profiler: all you have to do is select the appropriate template:
Get-DbaXESessionTemplate | Out-GridView

In this case you can use the “Profiler Standard” template and of course it’s there and you can do it with just a couple of lines of PowerShell:
Import-DbaXESessionTemplate -SqlInstance "localhost\SQLEXPRESS" -Name "Recipe01" -Template "Profiler Standard"Start-DbaXESession -Session "Recipe01" -SqlInstance " localhost\SQLEXPRESS"That couldn’t be easier! Notice that the commands above did not add any targets to the session: the streaming API will take care of processing the data.
If you don’t like dbatools or don’t want to use powershell, the script for the session is this:
IF NOT EXISTS ( SELECT * FROM sys.server_event_sessions WHERE name = 'Recipe01')

CREATE EVENT SESSION [Recipe01] ON SERVER
ADD EVENT sqlserver.attention(
    ACTION(
		 package0.event_sequence
		,sqlserver.client_app_name
		,sqlserver.client_pid
		,sqlserver.database_id
		,sqlserver.nt_username
		,sqlserver.query_hash
		,sqlserver.server_principal_name
		,sqlserver.session_id
	)
    WHERE ([package0].[equal_boolean]([sqlserver].[is_system],(0)))
),
ADD EVENT sqlserver.existing_connection(
	SET collect_options_text=(1)
    ACTION(
		 package0.event_sequence
		,sqlserver.client_app_name
		,sqlserver.client_pid
		,sqlserver.nt_username
		,sqlserver.server_principal_name
		,sqlserver.session_id
	)
),
ADD EVENT sqlserver.login(
	SET collect_options_text=(1)
    ACTION(
		 package0.event_sequence
		,sqlserver.client_app_name
		,sqlserver.client_pid
		,sqlserver.nt_username
		,sqlserver.server_principal_name
		,sqlserver.session_id
	)
),
ADD EVENT sqlserver.logout(
    ACTION(
		 package0.event_sequence
		,sqlserver.client_app_name
		,sqlserver.client_pid
		,sqlserver.nt_username
		,sqlserver.server_principal_name
		,sqlserver.session_id
	)
),
ADD EVENT sqlserver.rpc_completed(
    ACTION(
		 package0.event_sequence
		,sqlserver.client_app_name
		,sqlserver.client_pid
		,sqlserver.database_id
		,sqlserver.nt_username
		,sqlserver.query_hash
		,sqlserver.server_principal_name
		,sqlserver.session_id
	)
    WHERE ([package0].[equal_boolean]([sqlserver].[is_system],(0)))
),
ADD EVENT sqlserver.sql_batch_completed(
    ACTION(
		 package0.event_sequence
		,sqlserver.client_app_name
		,sqlserver.client_pid
		,sqlserver.database_id
		,sqlserver.nt_username
		,sqlserver.query_hash
		,sqlserver.server_principal_name
		,sqlserver.session_id
	)
    WHERE ([package0].[equal_boolean]([sqlserver].[is_system],(0)))
),
ADD EVENT sqlserver.sql_batch_starting(
    ACTION(
		 package0.event_sequence
		,sqlserver.client_app_name
		,sqlserver.client_pid
		,sqlserver.database_id
		,sqlserver.nt_username
		,sqlserver.query_hash
		,sqlserver.server_principal_name
		,sqlserver.session_id
	)
    WHERE ([package0].[equal_boolean]([sqlserver].[is_system],(0)))
);

IF NOT EXISTS ( SELECT * FROM sys.dm_xe_sessions WHERE name = 'Recipe01')
    ALTER EVENT SESSION Recipe01 ON SERVER STATE = START;
Now that you have a session running you can work with the events it captures, using XESmartTarget.
XESmartTarget
The tool already ships with multiple Response types: all you have to do is prepare a configuration file. In this case you will use a CsvAppenderResponse. If you go to the documentation page, you will see what properties are exposed by this Response type, which can be set in a JSON configuration file.
OK, let’s do it! Following the example on the documentation, you can craft your own JSON file to configure XESmartTarget:
{
    "Target": {
        "ServerName": "(local)\\SQLEXPRESS",
        "SessionName": "Recipe01",
        "Responses": [
            {
                "__type": "CsvAppenderResponse",
                "OutputFile": "c:\\temp\\output.csv",
                "OverWrite": "true",
                "OutputColumns": [
                    "name",
                    "collection_time",
                    "client_app_name",
                    "server_principal_name",
                    "database_name",
                    "batch_text",
                    "statement"
                ],
                "Events": [
                    "rpc_completed",
                    "sql_batch_completed"
                ]
            }
        ]
    }
}
There are a couple of things to note on this file. First, it’s a JSON file, so it has to comply with the syntax of Javascript: backslash in strings has to be escaped with “\”, so it becomes “\\”. For each object in the “Responses” array, the property “__type” controls which Response type is used, then you can use its properties inside that block. For CsvAppenderResponse, the property “OutputColumns” controls which columns will be written to the CSV file. These columns are fields or actions from the events.
The property “Events” controls which events are processed by the current Response.
If your session captures multiple event types, you can choose which ones are processed by each Response, using the “Events” property. In this case, the profiler default template capture events that you don’t want to process, like existing connections, so you can filter for “rpc_completed” and “sql_batch_completed” events only.
Now, save the file as c:\temp\Recipe_01_Output_CSV.json and you can use it with XESmartTarget, by running this:
"%ProgramFiles%\XESmartTarget\xesmarttarget.exe" --File c:\temp\Recipe_01_Output_CSV.json

The output on the cmd window won’t tell you much, except that XESmartTarget is running, it’s connected to the appropriate session and the it’s writing to the CSV file.
Let’s check what happens if you run some commands from Azure Data Studio:

The cmd window doesn’t say anything new, but if you open the CSV file with VSCode you will see that some data has been saved:

Code is great for inspecting CSV files, because it has the ability to reload the file when new rows are added and also has nice plugins like Rainbow CSV to help you interpret the contents correctly.
When you are finished with your capture, you can press CTRL+C on the cmd window where XESmartTarget is running and it will shut down.
Recap
You wanted to save all the commands executed on your SQL Server to a CSV file on your computer. You had to set up a session for that, which was super easy, thanks to dbatools. Then you configured XESmartTarget to process all the events and save them to the CSV file of your choice. You could also watch the events flowing to the file in real-time, thanks to Code and its plugins.
In this recipe you familiarized with XESmartTarget and had a glimpse of its capabilities. The next recipe will introduce more capabilities and showcase more features of the JSON configuration format. Stay tuned!
10 DBA recipes with XESmartTarget
Some time ago, I started a project called XESmartTarget. I find it super useful and you should probably know about it. It’s totally my fault if you’re not using it and I apologize for all the pain that it could have saved you, but it didn’t because I did not promote it enough.
Now I want to remedy my mistake with a 10 days series of blog posts on XESmartTarget, which will show you how useful it can be and how it can be used to accomplish your daily DBA tasks using Extended Events.
In this first post of the series, I will introduce XESmartTarget, show how it works and how to configure it. For the next 10 days I will publish a post to show you how to solve a specific problem using XESmartTarget. Let’s go!
What is XESmartTarget?
XESmartTarget is a small command line utility that can connect to an Extended Events session using the streaming API and can perform actions in response to the events captured by the session. The actions can vary from saving to a table in a database, writing to a CSV file, sending alerts and many more.
You can think of XESmartTarget as a processing engine for Extended Events, that you can run from the command line, without having to write a single line of code.
Where does it run?
XESmartTarget does not need to run on the server, it can run on any Windows machine that can connect to the target SQL Server instance. You can certainly run it on the server, but you don’t need to. XESmartTarget depends on Microsoft Visual C++ 2013 Redistributable: if you have the client utilities (SSMS) on your computer then you’re good to go, otherwise you can always download from Microsoft. It doesn’t run on Linux, I’m sorry.
How do I get it?
It’s open-source software: you can download it from GitHub and install it. You have a x64 setup kit and a x86 setup kit: make sure to pick the correct version for your operating system. Your browser may complain about it being unsafe, despite being signed with a code signing cert (sigh…). Don’t worry, go ahead and download it. Windows may also complain when running the .msi, so you will have to bypass SmartScreen as well. By default, the software gets installed to c:\Program Files\XESmartTarget
Why do I need it?
The built-in targets for Extended Events are great, but they don’t cover 100% of the spectrum. Some targets, like writing to a database table, would be extremely useful but are not there. There are multiple reasons, but mainly this is because of performance concerns: Extended Events have been designed to be fast and have a low performance impact on the server being monitored. Writing to a file or to a memory buffer is a fast operation, writing to a table or applying additional logic can end up slowing down the collection process and the SQL Server instance. However, Microsoft decided to give us the ability to post-process the events in the .xel files or process the events in near real-time using the streaming API for Extended Events. XESmartTarget uses the streaming API to receive the events from the server and the API itself has a built-in protection mechanism that prevents the server from being chocked by the client: if the client can’t keep up with the data rate from the server, it gets disconnected.
Having an API to process events means that we can write code to perform common actions on the events. I created 7 types of Response classes, that can receive data from the events and process them to let you perform actions that you can’t perform using the built-in targets:
- CsvAppenderReponse – writes event data to a CSV file
- EmailResponse – sends alerts via email based on event data
- ExecuteTSQLResponse – runs T-SQL commands for each event captured
- TableAppenderReponse – writes event data to a table in a SQL Server database
- GroupedTableAppenderReponse – aggregates event data in memory and then merges with existing data in the target table
- ReplayResponse – replays sql_batch_completed and rpc_completed events
- GelfTcpResponse – writes events to a GrayLog server
- TelegrafAppenderReponse – writes to an InfluxDB database using Telegraf
Will I have to write code?
If you really, really want to write code, you can do it: XESmartTarget is a .dll library that you can incorporate in your project. That’s what we did with dbatools. The license is super permissive, so go ahead and do it!
However, one of the strengths of XESmartTarget is that it requires absolutely no coding: all you have to do is configure XESmartTarget to do what you want. It is a command line tool and it accepts some parameters:
-F|--File <path to the .JSON configuration file>
        Uses the supplied .json file to configure the source of the events and the list of responses
-N|--NoLogo
        Hides copyright banner at startup
-Q|--Quiet
        Suppresses output to console
-G|--GlobalVariables <variable1=value1 variableN=valueN>
        Replaces $variableN with valueN in configuration files
-L|--LogFile <path to log file>
        Writes the log to the file specified
As you can see, you can use a .json file to provide the configuration. Not everyone likes JSON for configuration files, but I find it easy to use and good enough for the purpose. A nice addition to the standard JSON format is the ability to add comments using the javascript notation.
A typical .json configuration file looks like this:
{
    "Target": {
        "ServerName": "server to monitor, where the session is running",
        "SessionName": "name of the session",
        "Responses": [
            {
                // Properties for Response1
            },
            {
                // Properties for ResponseN
            }
        ]
    }
}
Each Response subclass has a set of public properties that can be set in the configuration file. You can visit the documentation page for each Response type to discover what are the properties available to you and see an example json file.
For instance, TableAppenderResponse has some properties to set the target server/database/table for the events and you can set them like this:
{
    "Target": {
        "ServerName": "(local)\\SQLEXPRESS",
        "SessionName": "commands",
        "Responses": [
            {
                "__type": "TableAppenderResponse",
                "ServerName": "(local)\\SQLEXPRESS",
                "DatabaseName": "DBAStuff",
                "TableName": "queries",
                "AutoCreateTargetTable": true,
                "UploadIntervalSeconds": 10,
                "OutputColumns": [
                    "name",
                    "collection_time",
                    "client_app_name",
                    "server_principal_name",
                    "database_name",
                    "batch_text",
                    "statement"
                ],
                "Events": [
                    "rpc_completed",
                    "sql_batch_completed"
                ]
            }
        ]
    }
}
Once you have your .json configuration file ready and your Extended Events session running, you can start XESmartTarget. It’s a command like tool, so it won’t show any GUI, but it will print messages to the console or to the log file to indicate that it’s doing some work.
As an example, you can save the above as c:\temp\capture_commands.json and run it with this command line:
“C:\program files\xesmarttarget\xesmarttarget.exe” --File c:\temp\capture_commands.jsonYou will see something similar to this:

If you look in your database, you will see some rows in the target table:

If you want to stop XESmartTarget, you can press CTRL+C.
What else can it do?
The sky is the limit. In the next posts of this series, I will demonstrate how to accomplish typical DBA tasks using XESmartTarget and you will learn how to use the appropriate Response type for every need. You will also see how to unleash the most advanced features of the configuration files, to filter events, group and summarize data, use fields and actions as parameters and more.
Keep an eye on the xesmarttarget tag on this blog!
Where are my recipes?
There you go:
https://spaghettidba.com/2022/02/22/recipe-1-writing-extended-events-to-a-csv-file/
https://spaghettidba.com/2022/02/23/recipe-2-writing-extended-events-to-a-table/
https://spaghettidba.com/2022/02/24/recipe-3-merging-and-manipulating-events/
https://spaghettidba.com/2022/02/25/recipe-4-sending-alerts-via-email/
https://spaghettidba.com/2022/02/28/recipe-5-killing-blocking-spids/
https://spaghettidba.com/2022/02/28/recipe-6-auditing-successful-logins/
https://spaghettidba.com/2022/03/01/recipe-7-finding-unused-tables/
https://spaghettidba.com/2022/03/02/recipe-8-analyzing-a-workload/
https://spaghettidba.com/2022/03/03/recipe-9-capturing-queries-and-plans/
https://spaghettidba.com/2022/03/04/recipe-10-writing-events-to-influxdb/
SQLSaturday is dead, long live DataSaturdays
This is a very brief post to inform you that PASS has died, killed by the for-profit company behind it.
That’s sad beyond words, but we, as a community, are not destined to the same fate. The community will rise again and build something new.
One of the things that we don’t want to lose is SQLSaturday. It’s been a substantial vehicle for involving community members locally and globally. It has been the launchpad for many community speakers. It has been the opportunity for many people to connect with other community members, share their knowledge and learn something new. Connect, share, learn… that sound familiar, right?
We don’t want to take the existing SQL Saturday and give it a new name, we want to start a new community initiative that enables us to continue delivering events. It needs to be a platform that allows us to continue doing what we were doing.
Do you want to be involved? Here’s what you can do:
- Head to datasaturdays.com and have a look. There’s not much content right now, but you have to start from something…
- Go to GitHub and join the discussion
There are many aspects that we need to cover and we know we’re not perfect right now. Please bear with us, we want to improve.
The main message here is that we need your help to continue running events for people to share, network and learn. A name a just a name and there’s more that identifies our community.
Come and help us, be a part of the solution
Replaying Workloads to a different Database
One of the features I was asked to implement for WorkloadTools is the ability to replay commands to a database name different from the one recorded in the source workload.
This is something that I had been planning to implement for a while and it totally makes sense. Usually, you have two identical environments for the workload capture and replay, both with the same databases. Sometimes it makes sense to have two different databases as the source and target for the workload, for some particular reasons: resources constraints, ease of testing and so on.
WorkloadTools now supports replaying commands to a different database, using the DatabaseMap property of the ReplayConsumer.
DatabaseMap is a Dictionary of strings, so it can be expressed in the .json file as a key/value pair, where the key is the original database and the value is the new target database for the command.
Here is an example:
{
    "__type": "ReplayConsumer",
    "ConnectionInfo": {
        "ServerName": "somedatabase.database.windows.net",
        "DatabaseName": "mario",
        "UserName": "itsame",
        "Password": "itsamario"
    },
    "DatabaseMap": {
        "Mario": "Luigi",
        "Peach": "Bowser"
    }
}
In this case, whenever a command from the database “Mario” is found, it is replayed against the database “Luigi”. Similarly, when the database “Peach” is found, the command gets replayed on “Bowser”.
Please note that DatabaseMap only changes the database context and does not substitute any reference to the original database name in the code. For instance, if you had something like EXEC Mario.sys.sp_executesql 'SELECT 1' ,this would not be intercepted by DatabaseMap and would remain unchanged in your code.
Happy benchmarking with WorkladTools!
Performing a real-time replay with WorkloadTools
In a previous blog post, I showed you how to use WorkloadTools to replay a workload in two different scenarios. However, there is a third scenario that is worth exploring: the real-time replay.
Before we jump to how, I’d better spend some words on why a real-time replay is needed.
The main reason is the complexity involved in capturing and analyzing a workload for extended periods of time. Especially when performing migrations and upgrades, it is crucial to capture the entire business cycle, in order to cover all possible queries issued by the applications. All existing benchmarking tools require to capture the workload to a file before it can be analyzed and/or replayed, but this becomes increasingly complicated when the length of the business cycle grows.
The first complication has to do with the size of the trace files, that will have to be accommodated to a disk location, either local or remote. It is not reasonable to expect to capture a workload on a busy server for, let’s say two weeks, because the size of the trace files can easily get to a few hundred GBs in less than one hour.
The second complication has to do with the ability of the benchmarking tools to process the trace files: bigger and more numerous files increase enormously the chances of breaking the tools. If you ever captured a big workload to a set of trace files to feed it to ReadTrace, you probably know what I’m talking about and chances are that you witnessed a crash or two. If you tried it with DReplay, you now probably have an ample collection of exotic and unhelpful error messages.
In this context, being able to process the events as soon as they occur is a plus, so that storing them to a file of any type is not needed. This is exactly what WorkloadTools does with the real-time replay feature.
Performing a real-time replay
All the considerations made for replaying a saved workload also apply to this scenario. First of all, you will need to set up a target environment that contains an up to date copy of the production database. Log shipping is a great tool for this: you can restore a full backup from production and restore all logs until the two databases are in sync. Immediately after restoring the last log backup with recovery, you can start the capture and replay on the production server.
The .json file for this activity will probably look like this:
{
    "Controller": {

        "Listener":
        {
            "__type": "ExtendedEventsWorkloadListener",
            "ConnectionInfo":
            {
                "ServerName": "SourceInstance"
            },
            "DatabaseFilter": "YourDatabase"
        },

        "Consumers":
        [
            {
                "__type": "ReplayConsumer",
                "ConnectionInfo":
                {
                    "ServerName": "TargetInstance",
                    "DatabaseName": "YourDatabase"
               }
            },
            {
                "__type": "AnalysisConsumer",
                "ConnectionInfo":
                {
                    "ServerName": "AnalysisInstance",
                    "DatabaseName": "SqlWorkload",
                    "SchemaName": "baseline"
                },
                "UploadIntervalSeconds": 60
            }
        ]
    }
}
On the target server, you can use SqlWorkload again to capture the performance data produced by the replay, using a .json file similar to the one used when analyzing the replay of a saved workload:
{
    "Controller": {
        "Listener":
        {
            "__type": "ExtendedEventsWorkloadListener",
            "ConnectionInfo":
            {
                "ServerName": "TargetInstance",
                "DatabaseName": "YourDatabase"
            }
        },

        "Consumers":
        [
            {
                "__type": "AnalysisConsumer",
                "ConnectionInfo":
                {
                    "ServerName": "AnalysisInstance",
                    "DatabaseName": "SqlWorkload",
                    // different schema from SqlWorkload 1
                    "SchemaName": "replay"
                },
                "UploadIntervalSeconds": 60
            }
        ]
    }
}
The overall architecture of the real-time replay looks like this:

It is crucial to start both instances of SqlWorkload at the same time, as the time dimension is always measured as the offset from the start of the analysis: starting both instances at the same time ensures that the same queries get executed around the same offset, so that you can compare apples to apples.
It is also extremely important to make sure that the target environment can keep up with the workload being replayed, otherwise the number of queries found in the same interval will never match between the two environments and the two workloads will start to diverge more and more. You can observe the data in WorkloadViewer while is gets written by the two analysis consumers and you can compare the number of batches per seconds to make sure that the target environment does not get overwhelmed by the workload. To refresh the data in WorkloadViewer, simply press F5.
The analysis and comparison of a real-time replay is not different from a deferred replay and you can use the same tools and apply the same considerations to both situations.
The interesting part of a real-time replay is the ability to perform the replay for extended periods of time, without the need to store the workload data to any type of intermediate format and without the need to analyze the workload data as a whole before you can proceed with the replay. The possibilities that this approach opens are really interesting and can be outside the usual scope of benchmarking tools.
As an example, you could decide to have a staging environment where you want to test the performance impact of new implementations directly against a production workload, gaining immediate insights regarding performance and catching runaway queries before they hit production. The traditional approach to this problem has always been based on test harnesses that simulate the critical parts of the workload, but building and maintaining these tools can be time consuming. With WorkloadTools you can measure the performance impact of your changes without having to build new tools and you can focus on what matters to you the most: your business.
Collecting Diagnostic data from multiple SQL Server instances with dbatools
Keeping their SQL Server instances under control is a crucial part of the job of a DBA. SQL Server offers a wide variety of DMVs to query in order to check the health of the instance and establish a performance baseline.
My favourite DMV queries are the ones crafted and maintained by Glenn Berry: the SQL Server Diagnostic Queries. These queries already pack the right amount of information and can be used to take a snapshot of the instance’s health and performance.
Piping the results of these queries to a set of tables at regular intervals can be a good way to keep an eye on the instance. Automation in SQL Server rhymes with dbatools, so today I will show you how to automate the execution of the diagnostic queries and the storage of the results to a centralized database that you can use as a repository for your whole SQL Server estate.
The script
The script I’m using for this can be found on GitHub and you can download it, modify it and adapt it to your needs.
I won’t include it here, there is really no need for that, as you can find it on Github already. So, go, grab it from this address, save it and open it in your favourite code editor.
Done? Excellent! Let’s go through it together.
The script, explained
What I really love about PowerShell is how simple it is to filter, extend and manipulate tabular data using the pipeline, in a way that resonates a lot with the experience of T-SQL developers.
The main part of the script is the one that invokes all the diagnostic queries included in the list $queries. This is done by invoking the cmdlet Invoke-DbaDiagnosticQuery, that takes care of using a version of the diagnostic query that matches the version of the target server and selecting the data. As usual with dbatools, the -SqlInstance parameter accepts a list of servers, so you can pass in the list of all the SQL Servers in your infrastructure.
Invoke-DbaDiagnosticQuery -SqlInstance $SourceServer -QueryName $queries
Sometimes the queries do not generate any data, so it is important to filter out the empty result sets.
Where-Object { $_.Result -ne $null }
In order to store the data collected at multiple servers and multiple points in time, you need to attach some additional columns to the result sets before writing them to the destination tables. This is a very simple task in PowerShell and it can be accomplished by using the Select-Object cmdlet.
Select-Object accepts a list of columns taken from the input object and can also add calculated columns using hashtables with label/expression pairs. The syntax is not the friendliest possible (in fact, I have to look it up every time I need it), but it gets the job done.
In this case, you need to add a column for the server name, one for the database name (only for database scoped queries) and one for the snapshot id. I decided to use a timestamp in the yyyyMMdd as the snapshot id. This is what the code to define the properties looks like:
        $TableName = $_.Name
        $DatabaseName = $_.Database
        $ServerName = $_.SqlInstance

        $snapshotProp = @{
            Label = "snapshot_id"
            Expression = {$SnapshotId}
        }
        $serverProp = @{
            Label = "Server Name"
            Expression = {$ServerName}
        }
        $databaseProp = @{
            Label = "Database Name"
            Expression = {$DatabaseName}
        }
Now that the hashtables that define the additional properties are ready, you need to decide whether the input dataset requires the new properties or not: if a property with the same name is already present you need to skip adding the new property.
Unfortunately, this has to be done in two different ways, because the dataset produced by the diagnostic queries could be returned as a collection of System.Data.Datarow objects or as a collection of PsCustomObject.
        if(-not (($_.Result.PSObject.Properties | Select-Object -Expand Name) -contains "Server Name")) {
            if(($_.Result | Get-Member -MemberType NoteProperty -Name "Server Name" | Measure-Object).Count -eq 0) {
                $expr += ' $serverProp, '
            }
        }
Now comes the interesting part of the
script: the data has to get written to a destination table in a database.
Dbatools has a cmdlet for that called Write-DbaDataTable.
Among the abilities of this nifty cmdlet, you can auto create the destination tables based on the data found in the input object, thus making your life much easier. In order to pass all the parameters to this cmdlet, I will use a splat, which improves readability quite a bit.
        $expr += '*'

        $param = @{
            SqlInstance     = $DestinationServer
            Database        = $DestinationDatabase
            Schema          = $DestinationSchema
            AutoCreateTable = $true
            Table           = $TableName
            InputObject     = Invoke-Expression $expr
        }
        Write-DbaDataTable @param
As you can see, you need to pass a
destination server name, a database name, a schema name and a table name. As I
already mentioned, Write-DbaDataTable will take care of creating the target
table.
One thing to note is how the data is passed
to the cmdlet: the InputObject is the result of an expression, based on the
dynamic select list generated inside the ForeEach-Object cmdlet. This is very
similar to building a dynamic query in T-SQL.
Conclusion
This script can be downloaded from GitHub and you can schedule it on a centralized management server in order to collect diagnostic data across your entire SQL Server estate.
Dbatools is the ultimate toolset for the dba: if you’re still using the GUI or overly complicated T-SQL scripts to administer and maintain your SQL Server estate, you’re missing out.
Dbatools is also a great opportunity for me to learn new tricks in Powershell, which is another great productivity tool that can’t be overlooked by DBAs. What are you waiting for? Go to dbatools.io now and start your journey: you won’t regret it.
Troubleshooting “Could not obtain information about Windows NT group/user”
This is one of those typical blog posts that I write for my future self, the guy who keeps fixing the same stuff over and over and forgets what he did the next minute.
If you want to query information about a Windows user or group and its access path in SQLServer, you can use the extended stored procedure “xp_logininfo”. Here’s an example:
EXEC xp_logininfo 'MyDomain\SomeUser','all';
If everything is configured correctly, you will see a list of Windows accounts and the login(s) they are mapped to in SQLServer.
However, in some cases, the command fails with the infamous error message:
Could not obtain information about Windows NT group/user 'MyDomain\SomeUser', error code 0x5This happens every time SQLServer tries to query information about the Windows user from Active Directory and receives an error.
Understanding where the error comes from can be tricky, but it can become easier to troubleshoot when you understand what happens behind the scenes and what are the most likely causes.
The user does not exist
This is very easy to check: does the user exist in Windows? Did you misspell the name?
You can check this from a cmd window, issuing this command:
net user SomeUser /domain
If you spelled the user correctly, the command will return information about it, like description, password settings, group membership and so on.
If the user name is incorrect and cannot be found in AD, you will get an error message
The user name cannot be found.
Easy peasy: check your spelling and check your AD.
The service account does not have enough privileges to query AD
As I said, SQL Server needs to query AD to retrieve information about the user: if its service account doesn’t have enough privileges, the query will fail.
The most likely cause for this is a misconfiguration of the service account settings in SQL Server. To be more specific, it is very likely that SQL Server is configured to run as a local user who has no access to Active Directory at all. This happens when SQL Server runs as a per-service SID or one of the built-in local accounts (local service or localsystem).
It is very easy to check what account is being used to run SQL Server: all you need to do is query sys.dm_server_services.
SELECT servicename, service_account
FROM sys.dm_server_services;
If you see a local account being returned, go ahead and change your service account to a domain account, using the Configuration Manager.
If you still can’t query AD, maybe there is something wrong with the permissions on your AD objects. Try impersonating the SQL Server service account, open a cmd windows and issue the net user command.
> net user SomeUser /domain
The request will be processed at a domain controller for domain MyDomain

System error 5 has occurred.
Access is denied
If you get the “Access is denied” error message, you need to go to your AD and grant read permissions on that user/OU to the service account.
The service account does not have enough privileges to impersonate the windows user
This was a bit of a surprise for me. In order to retrieve information about the Windows user, SQL Server needs to impersonate it first and then will contact AD impersonating that user.
In order to impersonate a user, SQL Server needs to run under a service account user that has enough privileges to impersonate another user. This privilege is granted through a local policy.
Open the local security policy MMC (secpol.msc) and expand “Local Policies”, “User Rights Assignment”. Find the policy named “Impersonate a client after authentication” and double click it. You can verify whether the service account for SQL Server is granted this privilege, directly or through one of its groups.

Generally speaking, you don’t have to change this, because by default Windows grants this privilege to the “SERVICE” special identity. Any process running as a service is acting as the SERVICE special identity, including SQL Server. If you don’t find it listed here, add it back.
Windows permissions can get tricky at times. I hope that this post helps you (and me!) taming the beast.
Workload replay with WorkloadTools
In my last post, I described how to capture a workload to a file, in order to run a replay against your target environment at a later time. Well, that later time has come and you’re ready to roll.
Of course, WorkloadTools has got you covered.
Before I show you how SqlWorkload can run the replay, reading all data from the workload file, I need to spend some time describing how to set up your target environment. It may look superfluous, but getting this part right is they key to a successful benchmarking activity and allows you to make sure that you are comparing apples with apples.
Choosing a methodology
First of all, you need to decide what you want to discover and make sure you understand entirely how performing the replay will help you in your investigation. There are mainly two types of methodologies:
- Capture in production, analyze the workload, replay in test, analyze and compare the results
- Capture in production, replay and analyze in test to establish a baseline, change something and replay again in test to obtain a second benchmark, then compare the results
The first method is useful when you are interested in comparing two different scenarios that cannot be easily reproduced in a test environment. As an example of this situation, imagine a production server that sits on a SAN storage with no more space available to create a test environment. Management wants to buy a new SAN and obtains a box to conduct a POC. In this case you can set up a test environment on the new SAN and compare the benchmarks on the two different storages.
This way of benchmarking is not always ideal, because it tries to compare a workload captured in production with a workload captured as the replay of the production one. The two are not the same: they depend on the filters applied while capturing in production and can be affected by the conditions under which the replay is being performed. For this reason, this methodology should be used only when it is possible to accept the approximation due to resource constraints.
The second method is more convoluted, but it is often able to deliver more accurate results. With this method, both benchmarks are obtained by measuring the replay of the original workload in a controlled test environment, so that the way the replay itself is performed does not affect the comparison.
This second method is easier to use in situations when the test environment can be reused to obtain the two scenarios to measure. Imagine that you want to observe the effect of changing compatibility level or some other database level options: in this case you would need to replay the original workload, change compatibility level, run a second replay and compare the performance in the two scenarios.
However, not even this method is perfect and you really need to make sure that you understand what you want to measure. If you are looking for plan regressions due to changing something at the instance, database or object level, you probably don’t care much about the relative performance of the hardware, because it is unlikely to affect query performance more than the plan regression itself.
Setting up the environment
Another thing that has to be taken into account is what data the replay will be performed against. In order to obtain meaningful performance information, the workload should ideally be performed against the same database, with the data in the same exact state in both environments.
Working on data in different states can produce misleading results. Imagine that the production workload contains thousands of commands that operate changes to a particular order in a database for an e-commerce website: if you tried to replay that workload against a copy of the database taken one week before the order was created, you would not produce the same amount of reads and writes found in the production workload. This means that the two databases have to be synchronized, by performing a point int time restore in the test environment up to the moment in which the capture of the production workload has started.
If you have to replay the workload multiple times, it is recommended to take a database snapshot before you start the replay, so that you can revert to that snapshot before repeating the replay.
Replaying a Workload from production
In this case, the workload that you capture in production will act as the baseline and will be compared to the workload captured in test when performing the replay. WorkloadTools lets you choose when to analyze the source workload: you can do that during the workload capture, you can do that while performing the replay or you can do that at a later moment. In the first case, you just need to add a second consumer to the listener and let it write the performance data to a schema in the analysis database.
{
    "Controller": {

        // This listener connects to the source instance
        // using Extended Events
        "Listener":
        {
            "__type": "ExtendedEventsWorkloadListener",
            "ConnectionInfo":
            {
                "ServerName": "SourceInstance"
            },
            "DatabaseFilter": "YourDatabase"
        },

        "Consumers":
        [
            // This consumer analyzes the workload and saves
            // the analysis to a database, in the schema “baseline”
            {
                "__type": "AnalysisConsumer",
                "ConnectionInfo":
                {
                    "ServerName": "AnalysisInstance",
                    "DatabaseName": "SqlWorkload",
                    "SchemaName": "baseline"
                },
                "UploadIntervalSeconds": 60
            },
            // This consumer writes the workload to a file
            {
                "__type": "WorkloadFileWriterConsumer",
                "OutputFile": "C:\\temp\\SqlWorkload.sqlite"
            }
        ]
    }
}
If you decide to analyze the workload later, you can start a file listener and feed the events to an analysis consumer. This setup can come handy when the analysis database is not reachable from the machine where the capture is being performed. This is an example of how to perform the analysis using a workload file as the source:
{
    "Controller": {

        "Listener":
        {
            "__type": "FileWorkloadListener",
            "Source": "C:\\temp\\SqlWorkload.sqlite",
            "SynchronizationMode": "false"
        },

        "Consumers":
        [
            {
                "__type": "AnalysisConsumer",
                "ConnectionInfo":
                {
                    "ServerName": "AnalysisInstance",
                    "DatabaseName": "SqlWorkload",
                    "SchemaName": "baseline"
                },
                "UploadIntervalSeconds": 60
            }
        ]
    }
}
Another option is to analyze the source workload while performing the replay. Here is a sample json file for that:
{
    "Controller": {

        "Listener":
        {
            "__type": "FileWorkloadListener",
            "Source": "C:\\temp\\SqlWorkload.sqlite",
            // in this case you want to simulate the original query rate
            "SynchronizationMode": "true"
        },

        "Consumers":
        [
            {
                "__type": "ReplayConsumer",
                "ConnectionInfo":
                {
                    "ServerName": "TargetInstance",
                    "DatabaseName": "YourDatabase"
                }
            },
            {
                "__type": "AnalysisConsumer",
                "ConnectionInfo":
                {
                    "ServerName": "AnalysisInstance",
                    "DatabaseName": "SqlWorkload",
                    "SchemaName": "baseline"
                },
                "UploadIntervalSeconds": 60
            }
        ]
    }
}
The replay workload has to be captured and analyzed as well, but you don’t need to record the queries to a workload file, because you are only after the performance data and you don’t need to replay the queries captured in this environment. All you need in this case is an instance of SqlWorkload with a listener connected to the test environment and a consumer to perform the analysis.
{
    "Controller": {

        // This listener points to the target instance
        // where the replay is being performed
        "Listener":
        {
            "__type": "ExtendedEventsWorkloadListener",
            "ConnectionInfo":
            {
                "ServerName": "TargetInstance",
                "DatabaseName": "DS3"
            }
        },

        "Consumers":
        [
            {
                "__type": "AnalysisConsumer",
                "ConnectionInfo":
                {
                    "ServerName": "AnalysisInstance",
                    "DatabaseName": "SqlWorkload",
                    "SchemaName": "replay"
                },
                "UploadIntervalSeconds": 60
            }
        ]
    }
}
The analysis data can be saved to the same target database used for the production workload, but it is not a requirement. In case you decide to use the same database, the target schema needs to be different.
Recording multiple benchmarks for the same workload
In this case, the workload captured in production will not be used as the baseline, but the baseline will be obtained by replaying it. This means that you don’t need to analyze the source workload and all you need to do is record it to a file.
Pointing to the target environment, you will need an instance of SqlWorkload with a listener configured to read the workload file and replay the events using a replay consumer.
{
    "Controller": {

        "Listener":
        {
            "__type": "FileWorkloadListener",
            "Source": "C:\\temp\\SqlWorkload.sqlite",
            // in this case you want to simulate the original query rate
            "SynchronizationMode": "true"
        },

        "Consumers":
        [
            {
                "__type": "ReplayConsumer",
                "ConnectionInfo":
                {
                    "ServerName": "TargetInstance",
                    "DatabaseName": "YourDatabase"
                }
            }
        ]
    }
}
In the same environment, you will have another instance of SqlWorkload with a listener capturing the events being replayed and an analysis consumer to write the performance data to an analysis database.
{
    "Controller": {

        // This listener points to the target instance
        // where the replay is being performed
        "Listener":
        {
            "__type": "ExtendedEventsWorkloadListener",
            "ConnectionInfo":
            {
                "ServerName": "TargetInstance",
                "DatabaseName": "DS3"
            }
        },

        "Consumers":
        [
            {
                "__type": "AnalysisConsumer",
                "ConnectionInfo":
                {
                    "ServerName": "AnalysisInstance",
                    "DatabaseName": "SqlWorkload",
                    "SchemaName": "benchmark01"
                },
                "UploadIntervalSeconds": 60
            }
        ]
    }
}
In order to obtain the second benchmark, you will now need to rewind the database to its initial state by performing a restore (using backups or a snapshot) and then you are ready to perform replay and capture once again. The .json files to use are almost identical to the ones that you used to obtain the first benchmark, except that you will need to specify a different schema to save the workload analysis.
{
    "Controller": {

        // This listener points to the target instance
        // where the replay is being performed
        "Listener":
        {
            "__type": "ExtendedEventsWorkloadListener",
            "ConnectionInfo":
            {
                "ServerName": "TargetInstance",
                "DatabaseName": "DS3"
            }
        },

        "Consumers":
        [
            {
                "__type": "AnalysisConsumer",
                "ConnectionInfo":
                {
                    "ServerName": "AnalysisInstance",
                    "DatabaseName": "SqlWorkload",
                    "SchemaName": "benchmark02"
                },
                "UploadIntervalSeconds": 60
            }
        ]
    }
}
Comparing benchmarks using WorkloadViewer
Regardless of the method that you decided to use, at the end of the replays, you will have two distinct sets of tables containing the workload analysis data, sitting in different schemas in the same database or in completely different databases.
WorkloadViewer will let you visualize performance over time, as we have seen for a single workload analysis, but this time it will be able to show you data from both workloads, so that you can compare them.
The first tab will still contain the charts for total duration, cpu and number of batches per second, with two different series:

The grid in the second tab will now show performance data by query for both benchmarks, so that you can easily spot regressions sorting by the difference:

The third tab will show you the details for a single query, with the detail broken down by application, hostname, username and databasename. It will also contain a chart to show you the behavior of the query over time.

Conclusions
Even when replaying a workload, WorkloadTools keep the promise of low complexity and allow you to perform all the activities involved in your benchmarking scenarios.
In the next post I will show you how to leverage the most interesting feature of WorkloadTools: the real-time replay. Stay tuned!
Life behind a proxy server: downloading content for SSMS Help Viewer
Life behind a proxy server can be problematic. Not every software out there is tested correctly for proxy interaction and oftentimes the experience for the corporate user is a bit frustrating.
I blogged about this before, regarding Powershell Gallery and regarding how to download and install content for the SSMS Help Viewer in SQL Server 2014 and SQL Server 2016.
When I tried to update my post for SQL Server 2017, I got stuck, because my “hack” stopped working with Help Viewer 2.3 and none of the things I tried was working. Bummer.
The problem:
Microsoft Help Viewer is unable to dowload the help content from the Microsoft website and if you click the error message on the bottom left of the status bar, it shows an error similar to this: “The web server has reported an error for https://services.mtps.microsoft.com/ServiceAPI/catalogs/Dev15/en-US: ProtocolIError/ProxyAuthenticationRequired“
How to fix it:
But there had to be a better way to do this and, I fiddled with it until I got it to work. Basically, all you have to do is instruct your applications to use a proxy server, with default authentication.
Discover what proxy server you are using: sometimes the proxy configuration only contains the URL of the autoconfiguration script (the pac file), but you don’t know what proxy is effectively in use. To display this information, open a cmd prompt and run this:netsh winhttp show proxy
You should see an output similar to this:
Current WinHTTP proxy settings:

    Proxy Server(s) :  http=proxy.mycompany.lan:8090
    Bypass List     :  (none)
Add the proxy information to the following text fragment and copy it to the clipboard:
<system.net>
    <settings>
        <ipv6 enabled="true" />
    </settings>
    <defaultProxy enabled="true" useDefaultCredentials="true">
        <proxy bypassonlocal="True" proxyaddress="http://MyProxyServer:MyProxyPort"/>
    </defaultProxy>
</system.net>
Run your favourite text editor as Administrator and open the following files in the Help Viewer installation folder (on my computer it’s "C:\Program Files (x86)\Microsoft Help Viewer\v2.3"):
HlpCtntMgr.exe.configHlpViewer.exe.config
Add the text fragment to both files, inside the <configuration> tag.
This is enough to let the the Help Viewer UI download and display the list of available content from the Microsoft website. Unfortunately, the actual transfer operation is performed by the BITS service, which has to be intructed to use a proxy server and complains with the following error message: “an error occurred while the bits service was transferring“.
This is done by changing a registry value. The key is the following:HKEY_LOCAL_MACHINE\SOFTWARE\Microsoft\Windows\CurrentVersion\BITS
And the value is UseLmCompat, which has to be set to 0.
You can do this easily by saving the following lines to a text file, save it with the .reg extension and merge it to you registry by double clicking.
Windows Registry Editor Version 5.00

[HKEY_LOCAL_MACHINE\SOFTWARE\Microsoft\Windows\CurrentVersion\BITS]
"UseLmCompat"=dword:00000000
Restart the BITS service (Background Intelligent Transfer Service).
Now you can go ahead and update you help library. Enjoy!
