Blog Archives
Benchmarking with WorkloadTools
If you ever tried to capture a benchmark on your SQL Server, you probably know that it is a complex operation. Not an impossible task, but definitely something that needs to be planned, timed and studied very thoroughly.
The main idea is that you capture a workload from production, you extract some performance information, then you replay the same workload to one or more environments that you want to put to test, while capturing the same performance information. At the end of the process, you can compare performance under different conditions, identify regressions, avoid unwanted situations and rate your tuning efforts.
A big part of the complexity, let’s face it, comes from the fact that the tools that we have had in our toolbelt so far are complex and suffer from a number of limitations that make this exercise very similar to a hurdle race.
If you want to replay a workload from production to test, you need to be able to capture the workload first. Even before you start, you’re already confronted with a myriad of questions:
- What do you use for this? A server-side trace? Extended events? Profiler maybe?
- Which events do you capture? Which fields?
- How long do you need to run the capture? How much is enough? One hour? One day? One week? One month?
- Can you apply some filters?
- Will you have enough disk space to store the captured data?
Throughout the years, you’ve had multiple tools for capturing workloads, each with its own strengths and limitations:
- Profiler
- GOOD: extremely easy to use
- BAD: non-negligible impact on the server
- Extended Events
- GOOD: lightweight
- BAD: not compatible with older versions of SQLServer
- SQL Trace
- GOOD: less impactful than profiler
- BAD: deprecated
However, capturing the workload is not enough: you need to be able to replay it and analyze/compare the performance data.
But fear not! You have some tools that can help you here:
- RML Utilities
- SQL Nexus
- Distributed Replay
- Database Experimentation Assistant (DEA)
The bad news is that (again) each of these tools has its limitations and hurdles, even if the tin says that any monkey could do it. There is nothing like running ReadTrace.exe or Dreplay.exe against a huge set of trace files, only to have it fail after two hours, without a meaningful error message (true story). Moreover, of all these tools, only Distributed Replay (and DEA, which is built on top of it) support Azure SqlDatabase and Azure Managed instances: if you’re working with Azure, be prepared to forget everything you know about traces and RML Utilities.
Introducing WorkloadTools
Throughout my career, I had to go through the pain of benchmarking often enough to get fed up with all the existing tools and decide to code my own. The result of this endeavor is WorkloadTools: a collection of tools to collect, analyze and replay SQL Server workloads, on premises and in the cloud.
At the moment, the project includes 3 tools:
- SqlWorkload – a command line tool to capture, replay and analyze a workload
- ConvertWorkload – a command line tool to convert existing workloads (traces and extended events) to the format used by SqlWorkload
- WorkloadViewer – a GUI tool to visualize and analyze workload data
SqlWorkload is different from the traditional tools, because it lets you choose the technology for the capture: SqlTrace, Extended Events or a pre-recorded workload file. SqlWorkload also lets you choose the platform that you prefer: it works with older versions of SqlServer (tested from 2008 onwards, but nothing prevents it from running on SqlServer 2000) and newer versions, like 2017 or 2019. But the groundbreaking feature of SqlWorkload is its ability to work with Azure Sql Database Managed Instances and Azure Sql Database, by capturing Extended Events on Azure blob storage.
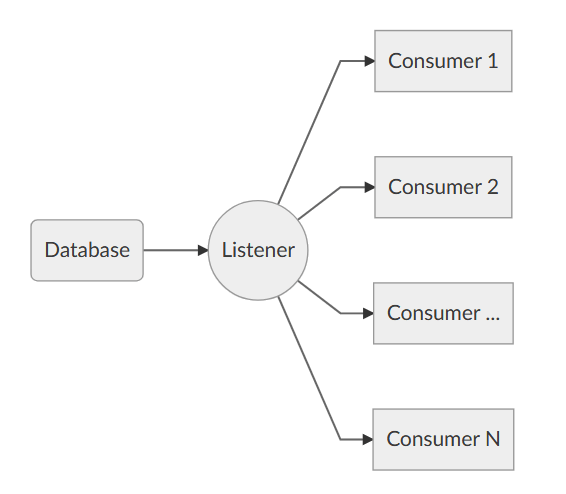
The capture is performed by a “Listener”, that reads the workload events from the source and forwards them immediately to a collection of “Consumers”, each specialized for performing a particular task on the events that it receives. You have a consumer for replaying the workload, a consumer for saving the workload to a file and a consumer for analyzing the workload to a database.
This flexible architecture allows you to do things differently from the existing tools. The traditional approach to benchmarking has always been:
- capture to one or more files
- analyze the files
- replay and capture
- analyze the files
- compare
SqlWorkload does not force you to save your workload to disk completely before you can start working with it, but it lets you forward the events to any type of consumer as soon as it is captured, thus enabling new types of workflows for your benchmarking activities. With SqlWorkload you are free to analyze the events while capturing, but you can also replay to a target database in real-time, while a second instance of SqlWorkload analyzes the events on the target.

If you’re used to a more traditional approach to benchmarking, you can certainly do things the usual way: you can capture a workload to a file, then use that file as a source for both the workload analysis and the replay. While replaying, you can capture the workload to a second set of files, that you can analyze to extract performance data. Another possibility is to analyze the workload directly while you capture it, writing to a workload file that you can use only for the replay.
As you can see, you have many possibilities and you are free to choose the solution that makes sense the most in your scenario. You may think that all this flexibility comes at the price of simplicity, but you’d be surprised by how easy it is to get started with WorkloadTools. SqlWorkload was designed to be as simple as possible, without having to learn and remember countless command line switches. Instead, it can be controlled by providing parameters in .JSON files, that can be saved, kept around and used as templates for the next benchmark.
For instance, the .JSON configuration file for “SqlWorkload A” in the picture above would look like this:
{
    "Controller": {

        "Listener":
        {
            "__type": "ExtendedEventsWorkloadListener",
            "ConnectionInfo":
            {
                "ServerName": "SourceServer",
                "DatabaseName": "SourceDatabase",
                "UserName": "sa",
                "Password": "P4$$w0rd!"
            },
            "DatabaseFilter": "SourceDatabase"
        },

        "Consumers":
        [
            {
                "__type": "ReplayConsumer",
                "ConnectionInfo":
                {
                    "ServerName": "TargetServer",
                    "DatabaseName": "TargetDatabase",
                    "UserName": "sa",
                    "Password": "Pa$$w0rd!"
                }
            },
            {
                "__type": "AnalysisConsumer",
                "ConnectionInfo":
                {
                    "ServerName": "AnalysisServer",
                    "DatabaseName": "AnalysisDatabase",
                    "SchemaName": "baseline",
                    "UserName": "sa",
                    "Password": "P4$$w0rd!"
                },
                "UploadIntervalSeconds": 60
            }
        ]
    }
}
As you can see, SqlWorkload expects very basic information and does not need to set up complex traces or XE sessions: all you have to do is configure what type of Listener to use and its parameters, then you need to specify which Consumers to use and their parameters (mainly connection details and credentials) and SqlWorkload will take care of the rest.
If you need to do control the process in more detail, you can certainly do so: the full list of parameters that you can specify in .JSON files is available in the documentation of SqlWorkload at GitHub.
Once the capture is over and you completely persisted the workload analysis to a database, you can use WorkloadViewer to visualize it. WorkloadViewer will show you charts for Cpu, Duration and Batches/sec, comparing how the two benchmarks performed. You can also use the filters at the top to focus the analysis on a subset of the data or you can zoom and pan on the horizontal axis to select a portion of the workload to analyze.

You can also use the “Queries” tab to see an overview of the individual batches captured in the workload. For each of those batches, you’ll be able to see the text of the queries and you will see stats for cpu, duration, reads, writes and number of executions. Sorting by any of these columns will let you spot immediately the regressions between the baseline and the benchmark and you will know exactly where to start tuning.

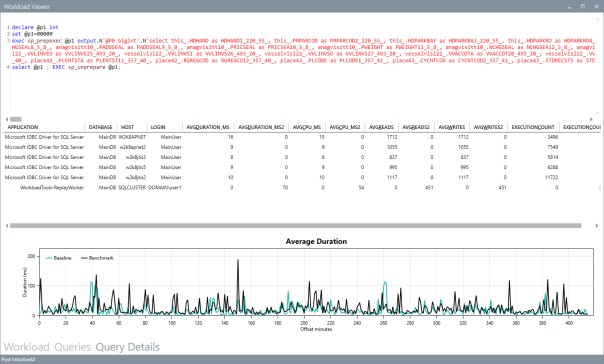
If you double click one of the queries, you will go to the Query Details tab, which will show you additional data about the selected query, along with its performance over time:
If WorkloadViewer is not enough for you, the project also includes a PowerBI dashboard that you can use to analyze the data from every angle. Does it look exciting enough? Wait, there’s more…
If you already have a pre-captured workload in any format (SqlTrace or Extended Events) you can use the command line tool ConvertWorkload to create a new workload file in the intermediate format used and understood by SqlWorkload (spoiler: it’s a SqLite database), in order to use it as the source for a WorkloadFileListener. This means that you can feed your existing trace data to the WorkloadTools analysis database, or replay it to a test database, even if the workload was not captured with WorkloadTools in the first place.
We have barely scratched the surface of what WorkloadTools can do: in the next weeks I will post detailed information on how to perform specific tasks with WorkloadTools, like capturing to a workload file or performing a real-time replay. In the meantime, you can read the documentation or you can join me at SqlBits, where I will introduce WorkloadTools during my session.
Stay tuned!
Replaying Workloads with Distributed Replay
A couple of weeks ago I posted a method to convert trace files from the SQL Server 2012 format to the SQL Server 2008 format.
The trick works quite well and the trace file can be opened with Profiler or with ReadTrace from RML Utilities. What doesn’t seem to work just as well is the trace replay with Ostress (another great tool bundled in the RML Utilities).
For some reason, OStress refuses to replay the whole trace file and starts throwing lots of errors.
Some errors are due to the workload I was replaying (it contains CREATE TABLE statements and that can obviuosly work just the first time it is issued), but some others seem to be due to parsing errors, probably because of differences in the trace format between version 11 and 10.
11/20/12 12:30:39.008 [0x00001040] File C:\RML\SQL00063.rml: Parser Error: [Error: 60500][State: 1][Abs Char: 1068][Seq: 0] Syntax error [parse error, expecting `tok_RML_END_RPC'] encountered near
0x0000042C: 6C000D00 0A005700 48004500 52004500 l.....W.H.E.R.E.
0x0000043C: 20005500 6E006900 74005000 72006900  .U.n.i.t.P.r.i.
0x0000044C: 63006500 20002600 6C007400 3B002000 c.e. .&.l.t.;. .
0x0000045C: 24003500 2E003000 30000D00 0A004F00 $.5...0.0.....O.
0x0000046C: 52004400 45005200 20004200 59002000 R.D.E.R. .B.Y. .
0x0000047C: 50007200 6F006400 75006300 74004900 P.r.o.d.u.c.t.I.
0x0000048C: 44002C00 20004C00 69006E00 65005400 D.,. .L.i.n.e.T.
0x0000049C: 6F007400 61006C00 3B000D00 0A003C00 o.t.a.l.;.....<. 0x000004AC: 2F004300 4D004400 3E000D00 0A003C00 /.C.M.D.>.....<. 0x000004BC: 2F004C00 41004E00 47003E00 0D000A00 /.L.A.N.G.>.....
0x000004CC:

11/20/12 12:30:39.010 [0x00001040] File C:\RML\SQL00063.rml: Parser Error: [Error: 110010][State: 100][Abs Char: 1068][Seq: 0] SYNTAX ERROR: Parser is unable to safely recover. Correct the errors and try again.
The error suggests that the two formats are indeed more different than I supposed, thus making the replay with Ostress a bit unrealiable.
Are there other options?
Sure there are! Profiler is another tool that allows replaying the workload, even if some limitations apply. For instance, Profiler cannot be scripted, which is a huge limitation if you are using Ostress in benchmarking script and want to replace it with something else.
That “something else” could actually be the Distributed Replay feature introduced in SQL Server 2012.
Basically, Distributed Replay does the same things that Ostress does and even more, with the nice addition of the possibility to start the replay on multiple machines, thus simulating a workload that resembles more the one found in production.
An introduction to Distributed Replay can be found on Jonathan Kehayias’ blog and I will refrain from going into deep details here: those posts are outstanding and there’s very little I could add to that.
Installing the Distributed Replay feature
The first step for the installation is adding a new user for the distributed replay services. You could actually use separate accounts for the Controller and Client services, but for a quick demo a single user is enough.

The Distributed Replay Controller and Client features must be selected from the Feature Selection dialog of SQLServer setup:

In the next steps of the setup you will also be asked the service accounts to use for the services and on the Replay Client page you will have to enter the controller name and the working directories.
Once the setup is over, you will find two new services in the Server Manager:

After starting the services (first the Controller, then the Client), you can go to the log directories and check in the log files if everything is working.
The two files to check are in the following folders:
- C:\Program Files (x86)\Microsoft SQL Server\110\Tools\DReplayController\Log
- C:\Program Files (x86)\Microsoft SQL Server\110\Tools\DReplayClient\Log
Just to prove one more time that “if something can wrong, it will”, the client log will probably contain an obnoxious error message.
DCOM gotchas
Setting up the distributed replay services can get tricky because of some permissions needed to let the client connect to the controller. Unsurprisingly, the client/controller communication is provided by DCOM, which must be configured correctly.
Without granting the appropriate permissions, in the distributed replay client log file you may find the following message:
2012-11-03 00:43:04:062 CRITICAL [Client Service] [0xC8100005 (6)] Failed to connect controller with error code 0x80070005.
In practical terms, the service account that executes the distributed replay controller service must be granted permissions to use the DCOM class locally and through the network:
- Run dcomcnfg.exe
- Navigate the tree to Console Root, Component Services, Computers, My Computer, DCOM Config, DReplayController
- Right click DReplayController and choose “properties” from the context menu.
- Click the Security tab
- Click the “Launch and Activation Permissions” edit button and grant “Local Activation” and “Remote Activation” permissions to the service account
- Click the “Access Permissions” edit button and grant “Local Access” and “Remote Access” permissions to the service account
- Add the service user account to the “Distributed COM Users” group
- Restart the distributed replay controller and client services
After restarting the services, you will find that the message in the log file has changed:
2012-11-20 14:01:10:783 OPERATIONAL [Client Service] Registered with controller "WIN2012_SQL2012".
Using the Replay feature
Once the services are successfully started, we can now start using the Distributed Replay feature.
The trace file has to meet the same requirements for replay found in Profiler, thus making the “Replay” trace template suitable for the job.
But there’s one more step needed before we can replay the trace file, which cannot be replayed directly. In fact, distributed replay needs to work on a trace stub, obtained preprocessing the original trace file.
The syntax to obtain the stub is the following:
"C:\Program Files (x86)\Microsoft SQL Server\110\Tools\Binn\dreplay.exe" preprocess -i "C:\SomePath\replay_trace.trc" -d "C:\SomePath\preprocessDir"
Now that the trace stub is ready, we can start the replay admin tool from the command line, using the following syntax:
"C:\Program Files (x86)\Microsoft SQL Server\110\Tools\Binn\dreplay.exe" replay -s "targetServerName" -d "C:\SomePath\preprocessDir" -w "list,of,allowed,client,names"
A final word
A comparison of the features found in the different replay tools can be found in the following table:
| Profiler | Ostress | Distributed Replay | |
| Multithreading | YES | YES | YES |
| Debugging | YES | NO | NO |
| Synchronization mode | NO | YES | YES |
| Stress mode | YES | YES | YES |
| Distributed mode | NO | NO | YES |
| Scriptable | NO | YES | YES |
| Input format | Trace | Trace/RML/SQL | Trace |
The Distributed Replay Controller can act as a replacement for Ostress, except for the ability to replay SQL and RML files.
Will we be using RML Utilities again in the future? Maybe: it depends on what Microsoft decides to do with this tool. It’s not unlikely that the Distributed Replay feature will replace the RML Utilities entirely. The tracing feature itself has an unceartain future ahead, with the deprecation in SQL Server 2012. Probably this new feature will disappear in the next versions of SQLServer, or it will be ported to the Extended Events instrastructure, who knows?
One thing is sure: today we have three tools that support replaying trace files and seeing this possibilty disappear in the future would be very disappointing. I’m sure SQL Server will never disappoint us. 🙂
