Blog Archives
Benchmarking with WorkloadTools
If you ever tried to capture a benchmark on your SQL Server, you probably know that it is a complex operation. Not an impossible task, but definitely something that needs to be planned, timed and studied very thoroughly.
The main idea is that you capture a workload from production, you extract some performance information, then you replay the same workload to one or more environments that you want to put to test, while capturing the same performance information. At the end of the process, you can compare performance under different conditions, identify regressions, avoid unwanted situations and rate your tuning efforts.
A big part of the complexity, let’s face it, comes from the fact that the tools that we have had in our toolbelt so far are complex and suffer from a number of limitations that make this exercise very similar to a hurdle race.
If you want to replay a workload from production to test, you need to be able to capture the workload first. Even before you start, you’re already confronted with a myriad of questions:
- What do you use for this? A server-side trace? Extended events? Profiler maybe?
- Which events do you capture? Which fields?
- How long do you need to run the capture? How much is enough? One hour? One day? One week? One month?
- Can you apply some filters?
- Will you have enough disk space to store the captured data?
Throughout the years, you’ve had multiple tools for capturing workloads, each with its own strengths and limitations:
- Profiler
- GOOD: extremely easy to use
- BAD: non-negligible impact on the server
- Extended Events
- GOOD: lightweight
- BAD: not compatible with older versions of SQLServer
- SQL Trace
- GOOD: less impactful than profiler
- BAD: deprecated
However, capturing the workload is not enough: you need to be able to replay it and analyze/compare the performance data.
But fear not! You have some tools that can help you here:
- RML Utilities
- SQL Nexus
- Distributed Replay
- Database Experimentation Assistant (DEA)
The bad news is that (again) each of these tools has its limitations and hurdles, even if the tin says that any monkey could do it. There is nothing like running ReadTrace.exe or Dreplay.exe against a huge set of trace files, only to have it fail after two hours, without a meaningful error message (true story). Moreover, of all these tools, only Distributed Replay (and DEA, which is built on top of it) support Azure SqlDatabase and Azure Managed instances: if you’re working with Azure, be prepared to forget everything you know about traces and RML Utilities.
Introducing WorkloadTools
Throughout my career, I had to go through the pain of benchmarking often enough to get fed up with all the existing tools and decide to code my own. The result of this endeavor is WorkloadTools: a collection of tools to collect, analyze and replay SQL Server workloads, on premises and in the cloud.
At the moment, the project includes 3 tools:
- SqlWorkload – a command line tool to capture, replay and analyze a workload
- ConvertWorkload – a command line tool to convert existing workloads (traces and extended events) to the format used by SqlWorkload
- WorkloadViewer – a GUI tool to visualize and analyze workload data
SqlWorkload is different from the traditional tools, because it lets you choose the technology for the capture: SqlTrace, Extended Events or a pre-recorded workload file. SqlWorkload also lets you choose the platform that you prefer: it works with older versions of SqlServer (tested from 2008 onwards, but nothing prevents it from running on SqlServer 2000) and newer versions, like 2017 or 2019. But the groundbreaking feature of SqlWorkload is its ability to work with Azure Sql Database Managed Instances and Azure Sql Database, by capturing Extended Events on Azure blob storage.
The capture is performed by a “Listener”, that reads the workload events from the source and forwards them immediately to a collection of “Consumers”, each specialized for performing a particular task on the events that it receives. You have a consumer for replaying the workload, a consumer for saving the workload to a file and a consumer for analyzing the workload to a database.
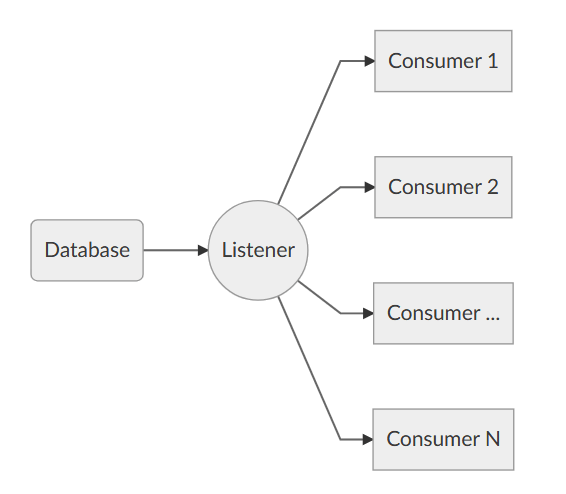
This flexible architecture allows you to do things differently from the existing tools. The traditional approach to benchmarking has always been:
- capture to one or more files
- analyze the files
- replay and capture
- analyze the files
- compare
SqlWorkload does not force you to save your workload to disk completely before you can start working with it, but it lets you forward the events to any type of consumer as soon as it is captured, thus enabling new types of workflows for your benchmarking activities. With SqlWorkload you are free to analyze the events while capturing, but you can also replay to a target database in real-time, while a second instance of SqlWorkload analyzes the events on the target.

If you’re used to a more traditional approach to benchmarking, you can certainly do things the usual way: you can capture a workload to a file, then use that file as a source for both the workload analysis and the replay. While replaying, you can capture the workload to a second set of files, that you can analyze to extract performance data. Another possibility is to analyze the workload directly while you capture it, writing to a workload file that you can use only for the replay.
As you can see, you have many possibilities and you are free to choose the solution that makes sense the most in your scenario. You may think that all this flexibility comes at the price of simplicity, but you’d be surprised by how easy it is to get started with WorkloadTools. SqlWorkload was designed to be as simple as possible, without having to learn and remember countless command line switches. Instead, it can be controlled by providing parameters in .JSON files, that can be saved, kept around and used as templates for the next benchmark.
For instance, the .JSON configuration file for “SqlWorkload A” in the picture above would look like this:
{
    "Controller": {

        "Listener":
        {
            "__type": "ExtendedEventsWorkloadListener",
            "ConnectionInfo":
            {
                "ServerName": "SourceServer",
                "DatabaseName": "SourceDatabase",
                "UserName": "sa",
                "Password": "P4$$w0rd!"
            },
            "DatabaseFilter": "SourceDatabase"
        },

        "Consumers":
        [
            {
                "__type": "ReplayConsumer",
                "ConnectionInfo":
                {
                    "ServerName": "TargetServer",
                    "DatabaseName": "TargetDatabase",
                    "UserName": "sa",
                    "Password": "Pa$$w0rd!"
                }
            },
            {
                "__type": "AnalysisConsumer",
                "ConnectionInfo":
                {
                    "ServerName": "AnalysisServer",
                    "DatabaseName": "AnalysisDatabase",
                    "SchemaName": "baseline",
                    "UserName": "sa",
                    "Password": "P4$$w0rd!"
                },
                "UploadIntervalSeconds": 60
            }
        ]
    }
}
As you can see, SqlWorkload expects very basic information and does not need to set up complex traces or XE sessions: all you have to do is configure what type of Listener to use and its parameters, then you need to specify which Consumers to use and their parameters (mainly connection details and credentials) and SqlWorkload will take care of the rest.
If you need to do control the process in more detail, you can certainly do so: the full list of parameters that you can specify in .JSON files is available in the documentation of SqlWorkload at GitHub.
Once the capture is over and you completely persisted the workload analysis to a database, you can use WorkloadViewer to visualize it. WorkloadViewer will show you charts for Cpu, Duration and Batches/sec, comparing how the two benchmarks performed. You can also use the filters at the top to focus the analysis on a subset of the data or you can zoom and pan on the horizontal axis to select a portion of the workload to analyze.

You can also use the “Queries” tab to see an overview of the individual batches captured in the workload. For each of those batches, you’ll be able to see the text of the queries and you will see stats for cpu, duration, reads, writes and number of executions. Sorting by any of these columns will let you spot immediately the regressions between the baseline and the benchmark and you will know exactly where to start tuning.

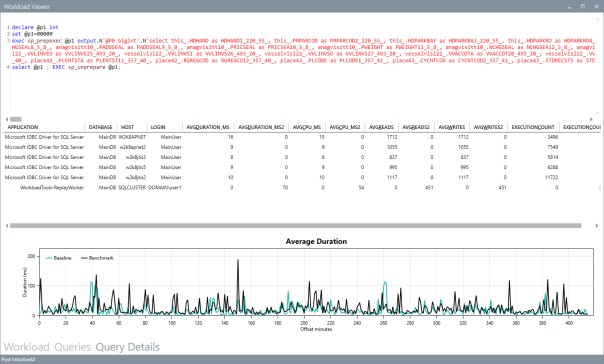
If you double click one of the queries, you will go to the Query Details tab, which will show you additional data about the selected query, along with its performance over time:
If WorkloadViewer is not enough for you, the project also includes a PowerBI dashboard that you can use to analyze the data from every angle. Does it look exciting enough? Wait, there’s more…
If you already have a pre-captured workload in any format (SqlTrace or Extended Events) you can use the command line tool ConvertWorkload to create a new workload file in the intermediate format used and understood by SqlWorkload (spoiler: it’s a SqLite database), in order to use it as the source for a WorkloadFileListener. This means that you can feed your existing trace data to the WorkloadTools analysis database, or replay it to a test database, even if the workload was not captured with WorkloadTools in the first place.
We have barely scratched the surface of what WorkloadTools can do: in the next weeks I will post detailed information on how to perform specific tasks with WorkloadTools, like capturing to a workload file or performing a real-time replay. In the meantime, you can read the documentation or you can join me at SqlBits, where I will introduce WorkloadTools during my session.
Stay tuned!
Ten features you had in Profiler that are missing in Extended Events
Oooooops!

I exchanged some emails about my post with Jonathan Kehayias and looks like I was wrong on many of the points I made.
I don’t want to keep misleading information around and I definitely need to fix my wrong assumptions.
Unfortunately, I don’t have the time to correct it immediately and I’m afraid it will have to remain like this for a while.
Sorry for the inconvenience, I promise I will try to fix it in the next few days.
SQL2014: Defining non-unique indexes in the CREATE TABLE statement
Now that my SQL Server 2014 CTP1 virtual machine is ready, I started to play with it and some new features and differences with the previous versions are starting to appear.
What I want to write about today is a T-SQL enhancement to DDL statements that brings in some new interesting considerations.
SQL Server 2014 now supports a new T-SQL syntax that allows defining an index in the CREATE TABLE statement without having to issue separate CREATE INDEX statements.
Up to now, the same could be achieved only with PRIMARY KEY and UNIQUE constraints, thus allowing UNIQUE indexes only.
For instance, the following statement creates a table with a unique clustered index on order_id and a unique nonclustered index on PO_number:
CREATE TABLE #orders (
     order_id uniqueidentifier NOT NULL
        PRIMARY KEY CLUSTERED DEFAULT NEWSEQUENTIALID()
    ,PO_number varchar(50) NOT NULL UNIQUE
    ,order_date datetime NOT NULL
    ,total_amount decimal(18,3)
)
OK, but what if I want to add a non-unique index to my table?
SQL Server 2014 offers a new syntax to do that inline with the table DDL:
CREATE TABLE #orders (
     order_id uniqueidentifier NOT NULL
        PRIMARY KEY CLUSTERED DEFAULT NEWSEQUENTIALID()
    ,PO_number varchar(50) NOT NULL UNIQUE
     -- creates a nonclustered index on order_date
    ,order_date datetime NOT NULL INDEX IX_order_date
    ,total_amount decimal(18,3)
)
A similar syntax can be used to create a compound index:
CREATE TABLE #orders (
     order_id uniqueidentifier NOT NULL
        PRIMARY KEY CLUSTERED DEFAULT NEWSEQUENTIALID()
    ,PO_number varchar(50) NOT NULL UNIQUE
    ,order_date datetime NOT NULL INDEX IX_order_date
    ,total_amount decimal(18,3)
    -- creates a compound index on PO_number and order_date
    ,INDEX IX_orders_compound(PO_number, order_date)
)
An interesting aspect of this new syntax is that it allows creating non-unique nonclustered indexes to table variables, which is something that couldn’t be done in the previous versions.
The syntax to use is the same as for permanent tables:
DECLARE @orders TABLE (
     order_id uniqueidentifier NOT NULL
        PRIMARY KEY CLUSTERED DEFAULT NEWSEQUENTIALID()
    ,PO_number varchar(50) NOT NULL UNIQUE
    ,order_date datetime NOT NULL INDEX IX_order_date
    ,total_amount decimal(18,3)
)
Cool! But, wait: does this mean that table variables will now behave in the same way permanent tables do?
Not exactly.
Table variables don’t have statistics, and being able to create indexes on them won’t change anything in this regard.
Do you want a proof? OK, the skeptics can run the following code. Please make sure you capture the actual execution plan.
SET NOCOUNT ON;

-- create the table variable
DECLARE @orders TABLE (
     order_id uniqueidentifier NOT NULL
        PRIMARY KEY CLUSTERED DEFAULT NEWSEQUENTIALID()
    ,PO_number varchar(50) NOT NULL UNIQUE
    ,order_date datetime NOT NULL INDEX IX_order_date
    ,total_amount decimal(18,3)
)

-- insert some data
INSERT INTO @orders (order_date, PO_number, total_amount)
SELECT
     order_date   = DATEADD(second, CHECKSUM(NEWID()), GETDATE())
    ,PO_number    = CAST(NEWID() AS varchar(50))
    ,total_amount = CHECKSUM(NEWID()) / 1000.0
FROM sys.all_columns

-
SELECT COUNT(*)
FROM @orders
WHERE order_date > GETDATE()
OPTION (
     -- activate some (undocumented) trace flags to show
     -- statistics usage. More information on the flags
     -- can be found on Paul White's blog:
     -- http://sqlblog.com/blogs/paul_white/archive/2011/09/21/how-to-find-the-statistics-used-to-compile-an-execution-plan.aspx

     -- redirect output to the messages tab
     QUERYTRACEON 3604
     -- show "interesting" statistics
    ,QUERYTRACEON 9292
    -- show loaded statistics
    ,QUERYTRACEON 9402
    -- add RECOMPILE to let the optimizer "see"
    -- the table cardinality
    ,RECOMPILE
)
The output of the above batch is empty. Looks like no stats were loaded.
The actual execution plan confirms that no stats were loaded and the estimated cardinality of the table variable is way off:

If we repeat the test with a temporary table, we see a different behaviour.
SET NOCOUNT ON;

IF OBJECT_ID('tempdb..#orders') IS NOT NULL
    DROP TABLE #orders;

CREATE TABLE #orders (
     order_id uniqueidentifier NOT NULL
        PRIMARY KEY CLUSTERED DEFAULT NEWSEQUENTIALID()
    ,PO_number varchar(50) NOT NULL UNIQUE
    ,order_date datetime NOT NULL INDEX IX_order_date
    ,total_amount decimal(18,3)
)

INSERT INTO #orders (order_date, PO_number, total_amount)
SELECT
     order_date   = DATEADD(second, CHECKSUM(NEWID()), GETDATE())
    ,PO_number    = CAST(NEWID() AS varchar(50))
    ,total_amount = CHECKSUM(NEWID()) / 1000.0
FROM sys.all_columns

SELECT COUNT(*)
FROM #orders
WHERE order_date > GETDATE()
OPTION (
     QUERYTRACEON 3604
    ,QUERYTRACEON 9292
    ,QUERYTRACEON 9402
)
This time the messages tab contains some output:
Stats header loaded: DbName: tempdb, ObjName: #orders, IndexId: 2, ColumnName: order_date, EmptyTable: FALSE

Stats header loaded: DbName: tempdb, ObjName: #orders, IndexId: 2, ColumnName: order_date, EmptyTable: FALSE
The optimizer identified the statistics on the oder_date column as “interesting” and then loaded the stats header.
Again, the actual execution plan confirms that a better estimation is available:

The lack of statistics has always been the most significant difference between table variables and temporary tables and SQL2014 doesn’t appear to change the rules (yet).
Using QUERYTRACEON in plan guides
Yesterday the CSS team made the QUERYTRACEON hint publicly documented.
This means that now it’s officially supported and you can use it in production code.
After reading the post on the CSS blog, I started to wonder whether there is some actual use in production for this query hint, given that it requires the same privileges as DBCC TRACEON, which means you have to be a member of the sysadmin role.
In fact, if you try to use that hint when connected as a low privileged user, you get a very precise error message, that leaves no room for interpretation:
SELECT *
FROM [AdventureWorks2012].[Person].[Person]
OPTION (QUERYTRACEON 4199)
Msg 2571, Level 14, State 3, Line 1
User ‘guest’ does not have permission to run DBCC TRACEON.
How can a query hint available to sysadmins only be possibly useful for production?
I posted my doubt on Twitter using the #sqlhelp hashtag and got interesting replies from Paul Randal, Paul White and Robert Davis.
My concerns were not about the usefulness of the hint per se, but about the usefulness in production code. Often 140 chars are not enough when you want to express your thoughts clearly, in fact I decided to write this blog post to clarify what I mean.
As we have seen, the QUERYTRACEON query hint cannot be used directly by users not in the sysadmin role, but it can be used in stored procedures with “EXECUTE AS owner” and in plan guides.
While it’s completely clear what happens when the hint is used in procedures executed in the context of the owner, what happens in plan guides is not so obvious (at least, not to me). In fact, given that the secuirty context is not changed when the plan guide is matched and applied, I would have expected it to fail miserably when executed by a low privileged user, but it’s not the case.
Let’s try and see what happens:
First of all we need a query “complex enough” to let the optimizer take plan guides into account. A straight “SELECT * FROM table” and anything else that results in a trivial plan won’t be enough.
SELECT *
FROM [Person].[Person] AS P
INNER JOIN [Person].[PersonPhone] AS H
    ON P.BusinessEntityID = H.BusinessEntityID
INNER JOIN [Person].[BusinessEntity] AS BE
    ON P.BusinessEntityID = BE.BusinessEntityID
INNER JOIN [Person].[BusinessEntityAddress] AS BEA
    ON BE.BusinessEntityID = BEA.BusinessEntityID
WHERE BEA.ModifiedDate > '20080101'
Then we need a plan guide to apply the QUERYTRACEON hint:
EXEC sp_create_plan_guide @name = N'[querytraceon]', @stmt = N'SELECT *
FROM [Person].[Person] AS P
INNER JOIN [Person].[PersonPhone] AS H
	ON P.BusinessEntityID = H.BusinessEntityID
INNER JOIN [Person].[BusinessEntity] AS BE
	ON P.BusinessEntityID = BE.BusinessEntityID
INNER JOIN [Person].[BusinessEntityAddress] AS BEA
	ON BE.BusinessEntityID = BEA.BusinessEntityID
WHERE BEA.ModifiedDate > ''20080101''', @type = N'SQL', @hints = N'OPTION (QUERYTRACEON 4199)'
If we enable the plan guide and try to issue this query in the context of a low privileged user, we can see no errors thrown any more:
CREATE LOGIN testlogin WITH PASSWORD = 'testlogin123';
GO
USE AdventureWorks2012;
GO
CREATE USER testlogin FOR LOGIN testlogin;
GO
GRANT SELECT TO testlogin;
GO
EXECUTE AS USER = 'testlogin';
GO
SELECT *
FROM [Person].[Person] AS P
INNER JOIN [Person].[PersonPhone] AS H
    ON P.BusinessEntityID = H.BusinessEntityID
INNER JOIN [Person].[BusinessEntity] AS BE
    ON P.BusinessEntityID = BE.BusinessEntityID
INNER JOIN [Person].[BusinessEntityAddress] AS BEA
    ON BE.BusinessEntityID = BEA.BusinessEntityID
WHERE BEA.ModifiedDate > '20080101';
GO
REVERT;
GO
If we open a profiler trace and capture the “Plan Guide Successful” and “Plan Guide Unsuccessful” events, we can see that the optimizer matches the plan guide and enforces the use of the query hint.
Lesson learned: even if users are not allowed to issue that particular query hint directly, adding it to a plan guide is a way to let anyone use it indirectly.
Bottom line is OPTION QUERYTRACEON can indeed be very useful when we identify some queries that obtain a decent query plan only when a specific trace flag is active and we don’t want to enable it for the whole instance. In those cases, a plan guide or a stored procedure in the owner’s context can be the answer.
Replaying Workloads with Distributed Replay
A couple of weeks ago I posted a method to convert trace files from the SQL Server 2012 format to the SQL Server 2008 format.
The trick works quite well and the trace file can be opened with Profiler or with ReadTrace from RML Utilities. What doesn’t seem to work just as well is the trace replay with Ostress (another great tool bundled in the RML Utilities).
For some reason, OStress refuses to replay the whole trace file and starts throwing lots of errors.
Some errors are due to the workload I was replaying (it contains CREATE TABLE statements and that can obviuosly work just the first time it is issued), but some others seem to be due to parsing errors, probably because of differences in the trace format between version 11 and 10.
11/20/12 12:30:39.008 [0x00001040] File C:\RML\SQL00063.rml: Parser Error: [Error: 60500][State: 1][Abs Char: 1068][Seq: 0] Syntax error [parse error, expecting `tok_RML_END_RPC'] encountered near
0x0000042C: 6C000D00 0A005700 48004500 52004500 l.....W.H.E.R.E.
0x0000043C: 20005500 6E006900 74005000 72006900  .U.n.i.t.P.r.i.
0x0000044C: 63006500 20002600 6C007400 3B002000 c.e. .&.l.t.;. .
0x0000045C: 24003500 2E003000 30000D00 0A004F00 $.5...0.0.....O.
0x0000046C: 52004400 45005200 20004200 59002000 R.D.E.R. .B.Y. .
0x0000047C: 50007200 6F006400 75006300 74004900 P.r.o.d.u.c.t.I.
0x0000048C: 44002C00 20004C00 69006E00 65005400 D.,. .L.i.n.e.T.
0x0000049C: 6F007400 61006C00 3B000D00 0A003C00 o.t.a.l.;.....<. 0x000004AC: 2F004300 4D004400 3E000D00 0A003C00 /.C.M.D.>.....<. 0x000004BC: 2F004C00 41004E00 47003E00 0D000A00 /.L.A.N.G.>.....
0x000004CC:

11/20/12 12:30:39.010 [0x00001040] File C:\RML\SQL00063.rml: Parser Error: [Error: 110010][State: 100][Abs Char: 1068][Seq: 0] SYNTAX ERROR: Parser is unable to safely recover. Correct the errors and try again.
The error suggests that the two formats are indeed more different than I supposed, thus making the replay with Ostress a bit unrealiable.
Are there other options?
Sure there are! Profiler is another tool that allows replaying the workload, even if some limitations apply. For instance, Profiler cannot be scripted, which is a huge limitation if you are using Ostress in benchmarking script and want to replace it with something else.
That “something else” could actually be the Distributed Replay feature introduced in SQL Server 2012.
Basically, Distributed Replay does the same things that Ostress does and even more, with the nice addition of the possibility to start the replay on multiple machines, thus simulating a workload that resembles more the one found in production.
An introduction to Distributed Replay can be found on Jonathan Kehayias’ blog and I will refrain from going into deep details here: those posts are outstanding and there’s very little I could add to that.
Installing the Distributed Replay feature
The first step for the installation is adding a new user for the distributed replay services. You could actually use separate accounts for the Controller and Client services, but for a quick demo a single user is enough.

The Distributed Replay Controller and Client features must be selected from the Feature Selection dialog of SQLServer setup:

In the next steps of the setup you will also be asked the service accounts to use for the services and on the Replay Client page you will have to enter the controller name and the working directories.
Once the setup is over, you will find two new services in the Server Manager:

After starting the services (first the Controller, then the Client), you can go to the log directories and check in the log files if everything is working.
The two files to check are in the following folders:
- C:\Program Files (x86)\Microsoft SQL Server\110\Tools\DReplayController\Log
- C:\Program Files (x86)\Microsoft SQL Server\110\Tools\DReplayClient\Log
Just to prove one more time that “if something can wrong, it will”, the client log will probably contain an obnoxious error message.
DCOM gotchas
Setting up the distributed replay services can get tricky because of some permissions needed to let the client connect to the controller. Unsurprisingly, the client/controller communication is provided by DCOM, which must be configured correctly.
Without granting the appropriate permissions, in the distributed replay client log file you may find the following message:
2012-11-03 00:43:04:062 CRITICAL [Client Service] [0xC8100005 (6)] Failed to connect controller with error code 0x80070005.
In practical terms, the service account that executes the distributed replay controller service must be granted permissions to use the DCOM class locally and through the network:
- Run dcomcnfg.exe
- Navigate the tree to Console Root, Component Services, Computers, My Computer, DCOM Config, DReplayController
- Right click DReplayController and choose “properties” from the context menu.
- Click the Security tab
- Click the “Launch and Activation Permissions” edit button and grant “Local Activation” and “Remote Activation” permissions to the service account
- Click the “Access Permissions” edit button and grant “Local Access” and “Remote Access” permissions to the service account
- Add the service user account to the “Distributed COM Users” group
- Restart the distributed replay controller and client services
After restarting the services, you will find that the message in the log file has changed:
2012-11-20 14:01:10:783 OPERATIONAL [Client Service] Registered with controller "WIN2012_SQL2012".
Using the Replay feature
Once the services are successfully started, we can now start using the Distributed Replay feature.
The trace file has to meet the same requirements for replay found in Profiler, thus making the “Replay” trace template suitable for the job.
But there’s one more step needed before we can replay the trace file, which cannot be replayed directly. In fact, distributed replay needs to work on a trace stub, obtained preprocessing the original trace file.
The syntax to obtain the stub is the following:
"C:\Program Files (x86)\Microsoft SQL Server\110\Tools\Binn\dreplay.exe" preprocess -i "C:\SomePath\replay_trace.trc" -d "C:\SomePath\preprocessDir"
Now that the trace stub is ready, we can start the replay admin tool from the command line, using the following syntax:
"C:\Program Files (x86)\Microsoft SQL Server\110\Tools\Binn\dreplay.exe" replay -s "targetServerName" -d "C:\SomePath\preprocessDir" -w "list,of,allowed,client,names"
A final word
A comparison of the features found in the different replay tools can be found in the following table:
| Profiler | Ostress | Distributed Replay | |
| Multithreading | YES | YES | YES |
| Debugging | YES | NO | NO |
| Synchronization mode | NO | YES | YES |
| Stress mode | YES | YES | YES |
| Distributed mode | NO | NO | YES |
| Scriptable | NO | YES | YES |
| Input format | Trace | Trace/RML/SQL | Trace |
The Distributed Replay Controller can act as a replacement for Ostress, except for the ability to replay SQL and RML files.
Will we be using RML Utilities again in the future? Maybe: it depends on what Microsoft decides to do with this tool. It’s not unlikely that the Distributed Replay feature will replace the RML Utilities entirely. The tracing feature itself has an unceartain future ahead, with the deprecation in SQL Server 2012. Probably this new feature will disappear in the next versions of SQLServer, or it will be ported to the Extended Events instrastructure, who knows?
One thing is sure: today we have three tools that support replaying trace files and seeing this possibilty disappear in the future would be very disappointing. I’m sure SQL Server will never disappoint us. 🙂
More on converting Trace Files
Yesterday I posted a method to convert trace files from SQL Server 2012 to SQL Server 2008R2 using a trace table.
As already mentioned in that post, having to load the whole file into a trace table has many shortcomings:
- The trace file can be huge and loading it into a trace table could take forever
- The trace data will consume even more space when loaded into a SQL Server table
- The table has to be written back to disk in order to obtain the converted file
- You need to have Profiler 2008 in order to write a trace in the “old” format
- You need to have a SQL Server 2008 instance to dump the trace table back to the file, as Profiler 2008 won’t connect to a SQL Server 2012
That said, it would really be useful if the file could be updated in place, changing just the version byte…
No worries: PowerShell to the rescue!
## =============================================
## Author:      Gianluca Sartori - @spaghettidba
## Create date: 2012-11-07
## Description: Changes the version information
##              in the header of a SQL Server trace
## =============================================
cls

# Enter your filename here
$fileName = "somefile.trc"

# The version information we want to write: 0x0A = 10 = SQLServer 2008
[Byte[]] $versionData = 0x0A
# The offset of the version information in the file
$offset = 390

[System.IO.FileMode] $open = [System.IO.FileMode]::OpenOrCreate
$stream = New-Object System.IO.FileStream -ArgumentList $fileName, $open
$stream.Seek($offset, [System.IO.SeekOrigin]::Begin);
$stream.Write($versionData, 0, $versionData.Length);
$stream.Close()
This script overwrites the version byte in the trace file, which lies at offset 390, changing it from 11 to 10.
This way, even a huge 100 GB trace file can be converted in milliseconds, ready to be consumed by ReadTrace or Profiler.
Enjoy!
P.S.: I haven’t tried, but I guess it could work with previous versions. However, tracing is deprecated in SQL Server 2012 and I guess it doesn’t introduce many differences from the SQL Server 2008 trace file format. The same cannot be said for SQL Server 2005 and I suppose that the file wouldn’t open anyway in Profiler. Unfortunately, I don’t have a SQL Server 2005 around to test.
Convert a Trace File from SQLServer 2012 to SQLServer 2008R2
Recently I started using RML utilities quite a lot.
ReadTrace and Ostress are awesome tools for benchmarking and baselining and many of the features found there have not been fully implemented in SQLServer 2012, though Distributed Replay was a nice addition.
However, as you may have noticed, ReadTrace is just unable to read trace files from SQLServer 2012, so you may get stuck with a trace file you wont’ abe able to process.
When I first hit this issue, I immediately thought I could use a trace table to store the data and then use Profiler again to write back to a trace file.
The idea wasn’t bad, but turns out that Profiler 2012 will always write trace files in the new format, with no way to specify the old one. On the other hand, Profiler2008R2 can’t read trace data from a table written by Profiler2012, throwing an ugly exception:

Interesting! So, looks like Profiler stores version information and other metadata somewhere in the trace table, but where exactly?
It might sound funny, but I had to trace Profiler with Profiler in order to know! Looking at the profiler trace, the first thing that Profiler does when trying to open a trace table is this:
declare @p1 int
set @p1=180150003
declare @p3 int
set @p3=2
declare @p4 int
set @p4=4
declare @p5 int
set @p5=-1
exec sp_cursoropen @p1 output,N'select BinaryData from [dbo].[trace_test] where RowNumber=0',@p3 output,@p4 output,@p5 output
select @p1, @p3, @p4, @p5
So, looks like Profiler stores its metadata in the first row (RowNumber = 0), in binary format.
That was the clue I was looking for!
I loaded a trace file in the old format into another trace table and I started to compare the data to find similarities and differences.
I decided to break the binary headers into Dwords and paste the results in WinMerge to hunt the differences:
-- Break the header row in the trace table into DWords
-- in order to compare easily in WinMerge
SELECT SUBSTRING(data, 8 * (n - 1) + 3, 8) AS dword
	,n AS dwordnum
FROM (
	SELECT CONVERT(VARCHAR(max), CAST(binarydata AS VARBINARY(max)), 1) AS data
	FROM tracetable
	WHERE rownumber = 0
	) AS src
INNER JOIN (
	SELECT DISTINCT ROW_NUMBER() OVER (
			ORDER BY (SELECT NULL)
		) / 8 AS n
	FROM sys.all_columns AS ac
	) AS v
	ON n > 0 AND (n - 1) * 8 <= LEN(data) - 3
ORDER BY 2
If you copy/paste the output in WinMerge you can easily spot the difference around the 100th dword:

Hmmmm, seems promising. Can those “11” and “10” possibly represent the trace version? Let’s try and see.
Now we should just update that section of the header to let the magic happen:
-- Use a table variable to cast the trace
-- header from image to varbinary(max)
DECLARE @header TABLE (
	header varbinary(max)
)

-- insert the trace header into the table
INSERT INTO @header
SELECT binarydata
FROM tracetable
WHERE RowNumber = 0

-- update the byte at offset 390 with version 10 (SQLServer 2008)
-- instead of version 11 (SQLServer 2012)
UPDATE @header
SET header .WRITE(0x0A,390,1)

-- write the header back to the trace table
UPDATE tracetable
SET binarydata = (SELECT header FROM @header)
WHERE RowNumber = 0
The trace table can now be opened with Profiler2008R2 and written back to a trace file. Hooray!
Yes, I know, using a trace table can take a whole lot of time and consume a lot of disk space when the file is huge (and typically RML traces are), but this is the best I could come up with.
I tried to look into the trace file itself, but I could not find a way to diff the binary contents in an editor. You may be smarter than me a give it a try: in that case, please, post a comment here.
Using this trick, ReadTrace can happily process the trace file and let you perform your benchmarks, at least until Microsoft decides to update RML Utilities to 2012.
UPDATE 11/08/2012: The use of a trace table is not necessary: the trace file can be updated in place, using the script found here.
Replay a T-SQL batch against all databases
It’s been quite a lot since I last posted on this blog and I apologize with my readers, both of them :-).
Today I would like to share with you a handy script I coded recently during a SQL Server health check. One of the tools I find immensely valuable for conducting a SQL Server assessment is Glenn Berry’s SQL Server Diagnostic Information Queries. The script contains several queries that can help you collect and analyze a whole lot of information about a SQL Server instance and I use it quite a lot.
The script comes with a blank results spreadsheet, that can be used to save the information gathered by the individual queries. Basically, the spreadsheet is organized in tabs, one for each query and has no preformatted column names, so that you can run the query, select the whole results grid, copy with headers and paste everything to the appropriate tab.
When working with multiple instances, SSMS can help automating this task with multiserver queries. Depending on your SSMS settings, the results of a multiserver query can be merged into a single grid, with an additional column holding the server name.


This feature is very handy, because it lets you run a statement against multiple servers without changing the statement itself.
This works very well for the queries in the first part of Glenn Berry’s script, which is dedicated to instance-level checks. The second part of the script is database-specific and you have to repeat the run+copy+paste process for each database in your instance.
It would be great if there was a feature in SSMS that allowed you to obtain the same results as the multiserver queries, scaled down to the database level. Unfortunately, SSMS has no such feature and the only possible solution is to code it yourself… or borrow my script!
Before rushing to the code, let’s describe briefly the idea behind and the challenges involved.
It would be quite easy to take a single statement and use it with sp_MsForEachDB, but this solution has several shortcomings:
- The results would display as individual grids
- There would be no easy way to determine which results grid belongs to which database
- The statement would have to be surrounded with quotes and existing quotes would have to be doubled, with an increased and unwanted complexity
The ideal tool for this task should simply take a statement and run it against all [user] databases without modifying the statement at all, merge the results in a single result set and add an additional column to hold the database name. Apparently, sp_MSForEachDB, besides being undocumented and potentially nasty, is not the right tool for the job.
That said, the only option left is to capture the statement from its query window, combining a trace, a loopback linked server and various other tricks.
Here’s the code:
-- =============================================
-- Author:      Gianluca Sartori - @spaghettidba
-- Create date: 2012-06-26
-- Description: Records statements to replay
--              against all databases.
-- =============================================
CREATE PROCEDURE replay_statements_on_each_db
    @action varchar(10) = 'RECORD',
    @start_statement_id int = NULL,
    @end_statement_id   int = NULL
AS
BEGIN

    SET NOCOUNT ON;

    DECLARE @TraceFile nvarchar(256);
    DECLARE @TraceFileNoExt nvarchar(256);
    DECLARE @LastPathSeparator int;
    DECLARE @TracePath nvarchar(256);
    DECLARE @TraceID int;
    DECLARE @fs bigint = 5;
    DECLARE @r int;
    DECLARE @spiid int = @@SPID;
    DECLARE @srv nvarchar(4000);
    DECLARE @ErrorMessage nvarchar(4000);
    DECLARE @ErrorSeverity int;
    DECLARE @ErrorState int;
    DECLARE @sql nvarchar(max);
    DECLARE @statement nvarchar(max);
    DECLARE @column_list nvarchar(max);

    IF @action NOT IN ('RECORD','STOPRECORD','SHOWQUERY','REPLAY')
        RAISERROR('A valid @action (RECORD,STOPRECORD,SHOWQUERY,REPLAY) must be specified.',16,1)

    -- *********************************************** --
    -- *                 RECORD                      * --
    -- *********************************************** --
    IF @action = 'RECORD'
    BEGIN

        BEGIN TRY

            -- Identify the path of the default trace
            SELECT @TraceFile = path
            FROM master.sys.traces
            WHERE id = 1

            -- Split the directory / filename parts of the path
            SELECT @LastPathSeparator = MAX(number)
            FROM master.dbo.spt_values
            WHERE type = 'P'
                  AND number BETWEEN 1 AND LEN(@tracefile)
                  AND CHARINDEX('\', @TraceFile, number) = number
            --' fix WordPress's sql parser quirks'

            SELECT @TraceFile =
                  SUBSTRING(
                         @TraceFile
                        ,1
                        ,@LastPathSeparator
                  )
                  + 'REPLAY_'
                  + CONVERT(char(8),GETDATE(),112)
                  + REPLACE(CONVERT(varchar(8),GETDATE(),108),':','')
                  + '.trc'

            SET @TraceFileNoExt = REPLACE(@TraceFile,N'.trc',N'')

            -- create trace
            EXEC sp_trace_create @TraceID OUTPUT, 0, @TraceFileNoExt, @fs, NULL;

            --add filters and events
            EXEC sp_trace_setevent @TraceID, 41, 1, 1;
            EXEC sp_trace_setevent @TraceID, 41, 12, 1;
            EXEC sp_trace_setevent @TraceID, 41, 13, 1;

            EXEC sp_trace_setfilter @TraceID, 1, 0, 7, N'%fn_trace_gettable%'
            EXEC sp_trace_setfilter @TraceID, 1, 0, 7, N'%replay_statements_on_each_db%'
            EXEC sp_trace_setfilter @TraceID, 12, 0, 0, @spiid

            --start the trace
            EXEC sp_trace_setstatus @TraceID, 1

            --create a global temporary table to store the statements
            IF OBJECT_ID('tempdb..##replay_info') IS NOT NULL
                DROP TABLE ##replay_info;

            CREATE TABLE ##replay_info (
                trace_id int,
                statement_id int,
                statement_text nvarchar(max)
            );

            --save the trace id in the global temp table
            INSERT INTO ##replay_info (trace_id) VALUES(@TraceID);

        END TRY
        BEGIN CATCH

            --cleanup the trace
            IF EXISTS( SELECT 1 FROM sys.traces WHERE id = @TraceId AND status = 1 ) EXEC sp_trace_setstatus @TraceID, 0;
            IF EXISTS( SELECT 1 FROM sys.traces WHERE id = @TraceId AND status = 0 ) EXEC sp_trace_setstatus @TraceID, 2;

            IF OBJECT_ID('tempdb..##replay_info') IS NOT NULL
                DROP TABLE ##replay_info;

            SELECT @ErrorMessage  = ERROR_MESSAGE(),
                   @ErrorSeverity = ERROR_SEVERITY(),
                   @ErrorState    = ERROR_STATE();

            RAISERROR(@ErrorMessage, @ErrorSeverity, @ErrorState);

        END CATCH

    END

    -- *********************************************** --
    -- *              STOP RECORDING                 * --
    -- *********************************************** --
    IF @action = 'STOPRECORD'
    BEGIN

        BEGIN TRY

            -- gather the trace id
            SELECT @TraceID = trace_id
            FROM ##replay_info;

            IF @TraceId IS NULL
                RAISERROR('No data has been recorded!',16,1)

            DELETE FROM ##replay_info;

            -- identify the trace file
            SELECT TOP(1) @TraceFile = path
            FROM sys.traces
            WHERE path like '%REPLAY[_]______________.trc'
            ORDER BY id DESC

            -- populate the global temporary table with
            -- the statements recorded in the
            INSERT INTO ##replay_info
            SELECT @TraceID,
                ROW_NUMBER() OVER(ORDER BY (SELECT NULL)),
                TextData
            FROM fn_trace_gettable(@traceFile, DEFAULT)
            WHERE TextData IS NOT NULL;

            --stop and deltete the trace
            IF EXISTS( SELECT 1 FROM sys.traces WHERE id = @TraceId AND status = 1 ) EXEC sp_trace_setstatus @TraceID, 0;
            IF EXISTS( SELECT 1 FROM sys.traces WHERE id = @TraceId AND status = 0 ) EXEC sp_trace_setstatus @TraceID, 2;

        END TRY
        BEGIN CATCH

            --stop and deltete the trace
            IF EXISTS( SELECT 1 FROM sys.traces WHERE id = @TraceId AND status = 1 ) EXEC sp_trace_setstatus @TraceID, 0;
            IF EXISTS( SELECT 1 FROM sys.traces WHERE id = @TraceId AND status = 0 ) EXEC sp_trace_setstatus @TraceID, 2;

            SELECT @ErrorMessage  = ERROR_MESSAGE(),
                   @ErrorSeverity = ERROR_SEVERITY(),
                   @ErrorState    = ERROR_STATE();

            RAISERROR(@ErrorMessage, @ErrorSeverity, @ErrorState);

        END CATCH

    END

    -- *********************************************** --
    -- *           SHOW COLLECTED QUERIES            * --
    -- *********************************************** --
    IF @action = 'SHOWQUERY'
    BEGIN
        BEGIN TRY

            IF OBJECT_ID('tempdb..##replay_info') IS NULL
                RAISERROR('No data has been recorded yet',16,1);

            SET @sql = 'SELECT statement_id, statement_text FROM ##replay_info ';

            IF @start_statement_id IS NOT NULL AND @end_statement_id IS NULL
                SET @sql = @sql + ' WHERE statement_id = @start_statement_id ';

            IF @start_statement_id IS NOT NULL AND @end_statement_id IS NOT NULL
                SET @sql = @sql + ' WHERE statement_id
                                    BETWEEN @start_statement_id AND @end_statement_id';

            EXEC sp_executesql
                 @sql
                ,N'@start_statement_id int, @end_statement_id int'
                ,@start_statement_id
                ,@end_statement_id;

        END TRY
        BEGIN CATCH
            SELECT @ErrorMessage  = ERROR_MESSAGE(),
                   @ErrorSeverity = ERROR_SEVERITY(),
                   @ErrorState    = ERROR_STATE();

            RAISERROR(@ErrorMessage, @ErrorSeverity, @ErrorState);
        END CATCH
    END

    -- *********************************************** --
    -- *                 REPLAY                      * --
    -- *********************************************** --
    IF @action = 'REPLAY'
    BEGIN

        BEGIN TRY

            --load the selected statement(s)
            SET @statement = '
                SET @sql = ''''
                SELECT @sql += statement_text + '' ''
                FROM ##replay_info
            ';

            IF @start_statement_id IS NOT NULL AND @end_statement_id IS NULL
                SET @statement =
                    @statement
                    + ' WHERE statement_id = @start_statement_id ';

            IF @start_statement_id IS NOT NULL AND @end_statement_id IS NOT NULL
                SET @statement =
                    @statement
                    + ' WHERE statement_id
                        BETWEEN @start_statement_id AND @end_statement_id';

            EXEC sp_executesql
                 @statement
                ,N'@start_statement_id int, @end_statement_id int, @sql nvarchar(max) OUTPUT'
                ,@start_statement_id
                ,@end_statement_id
                ,@sql OUTPUT;

            IF NULLIF(LTRIM(@sql),'') IS NULL
                RAISERROR('Unable to locate the statement(s) specified.',16,1)

            SET @srv = @@SERVERNAME; -- gather this server name

            IF EXISTS (SELECT * FROM sys.servers WHERE name = 'TMPLOOPBACK')
                EXEC sp_dropserver 'TMPLOOPBACK';

            -- Create a loopback linked server
            EXEC master.dbo.sp_addlinkedserver
                @server     = N'TMPLOOPBACK',
                @srvproduct = N'SQLServ', -- it’s not a typo: it can’t be “SQLServer”
                @provider   = N'SQLNCLI', -- change to SQLOLEDB for SQLServer 2000
                @datasrc    = @srv;

            -- Set the authentication to "current security context"
            EXEC master.dbo.sp_addlinkedsrvlogin
                @rmtsrvname  = N'TMPLOOPBACK',
                @useself     = N'True',
                @locallogin  = NULL,
                @rmtuser     = NULL,
                @rmtpassword = NULL;

            -- Use a permanent table in Tempdb to store the output
            IF OBJECT_ID('tempdb..___outputTable') IS NOT NULL
                DROP TABLE tempdb..___outputTable;

            -- Execute the statement in Tempdb to discover the column definition
            SET @statement = '
                SELECT TOP(0) *
                INTO tempdb..___outputTable
                FROM OPENQUERY(TMPLOOPBACK,''
                    SET FMTONLY OFF; EXEC tempdb.sys.sp_executesql N''''' + REPLACE(@sql,'''','''''''''') + '''''
                '')
            ';

            EXEC(@statement);

            SET @statement = @sql;

            -- Build the column list of the output table
            SET @column_list = STUFF((
                SELECT ',' + QUOTENAME(C.name)
                FROM tempdb.sys.columns AS C
                INNER JOIN tempdb.sys.tables AS T
                    ON C.object_id = T.object_id
                WHERE T.name = '___outputTable'
                FOR XML PATH('')
            ),1,1,SPACE(0));

            -- Add a "Database Name" column
            ALTER TABLE tempdb..___outputTable ADD Database__Name sysname;

            -- Build a sql statement to execute
            -- the recorded statement against all databases
            SET @sql =
                'N''INSERT tempdb..___outputTable(' + @column_list + ') EXEC(@statement); UPDATE tempdb..___outputTable SET Database__Name = DB_NAME() WHERE Database__Name IS NULL;''';

            -- Build a statement to execute on each database context
            ;WITH dbs AS (
                SELECT *,
                    system_db = CASE WHEN name IN ('master','model','msdb','tempdb') THEN 1 ELSE 0 END
                FROM sys.databases
                WHERE   DATABASEPROPERTY(name, 'IsSingleUser') = 0
                    AND HAS_DBACCESS(name) = 1
                    AND state_desc = 'ONLINE'
            )
            SELECT @sql = (
                SELECT
                    'EXEC ' + QUOTENAME(name) + '.sys.sp_executesql ' +
                        @sql + ',' +
                        'N''@statement nvarchar(max)'',' +
                        '@statement;' + char(10) AS [text()]
                FROM dbs
                ORDER BY name
                FOR XML PATH('')
            );

            -- Execute multi-db sql and pass in the actual statement
            EXEC sp_executeSQL @sql, N'@statement nvarchar(max)', @statement

            --
            SET @sql = '
                SELECT Database__Name AS [Database  Name], ' + @column_list + '
                FROM tempdb..___outputTable
                ORDER BY 1;
            '

            EXEC sp_executesql @sql;

            EXEC tempdb.sys.sp_executesql N'DROP TABLE ___outputTable';

        END TRY
        BEGIN CATCH
            SELECT @ErrorMessage  = ERROR_MESSAGE(),
                   @ErrorSeverity = ERROR_SEVERITY(),
                   @ErrorState    = ERROR_STATE();

            RAISERROR(@ErrorMessage, @ErrorSeverity, @ErrorState);
        END CATCH

    END

END
As you can see, the code creates a stored procedure that accepts a parameter named @action, which is used to determine what the procedure should do. Specialized sections of the procedure handle every possible value for the parameter, with the following logic:

First of all you start recording, then you execute the statements to repeat on each database, then you stop recording. From that moment on, you can enumerate the statements captured and execute them, passing a specific statement id or a range of ids.
The typical use of the procedure could look like this:
-- start recording
EXECUTE replay_statements_on_each_db
    @action = 'RECORD'

-- run the statements you want to replay
SELECT DATABASEPROPERTYEX(DB_NAME(),'Recovery') AS RecoveryModel

-- stop recording
EXECUTE replay_statements_on_each_db
    @action = 'STOPRECORD'

-- display captured statements
EXECUTE replay_statements_on_each_db
    @action = 'SHOWQUERY'

-- execute the first statement
EXECUTE replay_statements_on_each_db
    @action             = 'REPLAY',
    @start_statement_id = 1,
    @end_statement_id   = 1
You can see the results of the script execution here:

Obviuosly this approach is totally overkill for just selecting the database recovery model, but it can become very handy when the statement’s complexity raises.
This seems a perfect fit for Glen Berry’s diagnostic queries, which is where we started from. You can go back to that script and add the record instructions just before the database specific queries start:

At the end of the script you can add the instructions to stop recording and show the queries captured by the procedure.

Once the statements are recorded, you can run any of the statements against all databases. For instance, I decided to run the top active writes index query (query 51).

As expected, the procedure adds the database name column to the result set and then displays the merged results.
You may have noticed that I skipped the first statement in the database-specific section of the script, which is a DBCC command. Unfortunately, not all kind of statement can be captured with this procedure, because some limitations apply. Besides the inability to capture some DBCC commands, please note that the column names must be explicitly set.
I think that a CLR procedure could overcome these limitations, or at least some of them. I hope I will find the time to try the CLR method soon and I promise I will blog the results.
Trace Flag 3659
Many setup scripts for SQL Server include the 3659 trace flag, but I could not find official documentation that explains exactly what this flag means.
After a lot of research, I found a reference to this flag in a script called AddSelfToSqlSysadmin, written by Ward Beattie, a developer in the SQL Server product group at Microsoft.
The script contains a line which suggests that this flag enables logging all errors to errorlog during server startup. I’m unsure of what kind of errors are not logged without setting the flag, but I didn’t find any further reference. The BOL page for Trace Flags doesn’t list this one, so if you happen to know something more, feel free to add a comment here.
