Blog Archives
Ten features you had in Profiler that are missing in Extended Events
Oooooops!
I exchanged some emails about my post with Jonathan Kehayias and looks like I was wrong on many of the points I made.
I don’t want to keep misleading information around and I definitely need to fix my wrong assumptions.
Unfortunately, I don’t have the time to correct it immediately and I’m afraid it will have to remain like this for a while.
Sorry for the inconvenience, I promise I will try to fix it in the next few days.
Using QUERYTRACEON in plan guides
Yesterday the CSS team made the QUERYTRACEON hint publicly documented.
This means that now it’s officially supported and you can use it in production code.
After reading the post on the CSS blog, I started to wonder whether there is some actual use in production for this query hint, given that it requires the same privileges as DBCC TRACEON, which means you have to be a member of the sysadmin role.
In fact, if you try to use that hint when connected as a low privileged user, you get a very precise error message, that leaves no room for interpretation:
SELECT *
FROM [AdventureWorks2012].[Person].[Person]
OPTION (QUERYTRACEON 4199)
Msg 2571, Level 14, State 3, Line 1
User ‘guest’ does not have permission to run DBCC TRACEON.
How can a query hint available to sysadmins only be possibly useful for production?
I posted my doubt on Twitter using the #sqlhelp hashtag and got interesting replies from Paul Randal, Paul White and Robert Davis.
My concerns were not about the usefulness of the hint per se, but about the usefulness in production code. Often 140 chars are not enough when you want to express your thoughts clearly, in fact I decided to write this blog post to clarify what I mean.
As we have seen, the QUERYTRACEON query hint cannot be used directly by users not in the sysadmin role, but it can be used in stored procedures with “EXECUTE AS owner” and in plan guides.
While it’s completely clear what happens when the hint is used in procedures executed in the context of the owner, what happens in plan guides is not so obvious (at least, not to me). In fact, given that the secuirty context is not changed when the plan guide is matched and applied, I would have expected it to fail miserably when executed by a low privileged user, but it’s not the case.
Let’s try and see what happens:
First of all we need a query “complex enough” to let the optimizer take plan guides into account. A straight “SELECT * FROM table” and anything else that results in a trivial plan won’t be enough.
SELECT *
FROM [Person].[Person] AS P
INNER JOIN [Person].[PersonPhone] AS H
    ON P.BusinessEntityID = H.BusinessEntityID
INNER JOIN [Person].[BusinessEntity] AS BE
    ON P.BusinessEntityID = BE.BusinessEntityID
INNER JOIN [Person].[BusinessEntityAddress] AS BEA
    ON BE.BusinessEntityID = BEA.BusinessEntityID
WHERE BEA.ModifiedDate > '20080101'
Then we need a plan guide to apply the QUERYTRACEON hint:
EXEC sp_create_plan_guide @name = N'[querytraceon]', @stmt = N'SELECT *
FROM [Person].[Person] AS P
INNER JOIN [Person].[PersonPhone] AS H
	ON P.BusinessEntityID = H.BusinessEntityID
INNER JOIN [Person].[BusinessEntity] AS BE
	ON P.BusinessEntityID = BE.BusinessEntityID
INNER JOIN [Person].[BusinessEntityAddress] AS BEA
	ON BE.BusinessEntityID = BEA.BusinessEntityID
WHERE BEA.ModifiedDate > ''20080101''', @type = N'SQL', @hints = N'OPTION (QUERYTRACEON 4199)'
If we enable the plan guide and try to issue this query in the context of a low privileged user, we can see no errors thrown any more:
CREATE LOGIN testlogin WITH PASSWORD = 'testlogin123';
GO
USE AdventureWorks2012;
GO
CREATE USER testlogin FOR LOGIN testlogin;
GO
GRANT SELECT TO testlogin;
GO
EXECUTE AS USER = 'testlogin';
GO
SELECT *
FROM [Person].[Person] AS P
INNER JOIN [Person].[PersonPhone] AS H
    ON P.BusinessEntityID = H.BusinessEntityID
INNER JOIN [Person].[BusinessEntity] AS BE
    ON P.BusinessEntityID = BE.BusinessEntityID
INNER JOIN [Person].[BusinessEntityAddress] AS BEA
    ON BE.BusinessEntityID = BEA.BusinessEntityID
WHERE BEA.ModifiedDate > '20080101';
GO
REVERT;
GO
If we open a profiler trace and capture the “Plan Guide Successful” and “Plan Guide Unsuccessful” events, we can see that the optimizer matches the plan guide and enforces the use of the query hint.
Lesson learned: even if users are not allowed to issue that particular query hint directly, adding it to a plan guide is a way to let anyone use it indirectly.
Bottom line is OPTION QUERYTRACEON can indeed be very useful when we identify some queries that obtain a decent query plan only when a specific trace flag is active and we don’t want to enable it for the whole instance. In those cases, a plan guide or a stored procedure in the owner’s context can be the answer.
Replaying Workloads with Distributed Replay
A couple of weeks ago I posted a method to convert trace files from the SQL Server 2012 format to the SQL Server 2008 format.
The trick works quite well and the trace file can be opened with Profiler or with ReadTrace from RML Utilities. What doesn’t seem to work just as well is the trace replay with Ostress (another great tool bundled in the RML Utilities).
For some reason, OStress refuses to replay the whole trace file and starts throwing lots of errors.
Some errors are due to the workload I was replaying (it contains CREATE TABLE statements and that can obviuosly work just the first time it is issued), but some others seem to be due to parsing errors, probably because of differences in the trace format between version 11 and 10.
11/20/12 12:30:39.008 [0x00001040] File C:\RML\SQL00063.rml: Parser Error: [Error: 60500][State: 1][Abs Char: 1068][Seq: 0] Syntax error [parse error, expecting `tok_RML_END_RPC'] encountered near
0x0000042C: 6C000D00 0A005700 48004500 52004500 l.....W.H.E.R.E.
0x0000043C: 20005500 6E006900 74005000 72006900  .U.n.i.t.P.r.i.
0x0000044C: 63006500 20002600 6C007400 3B002000 c.e. .&.l.t.;. .
0x0000045C: 24003500 2E003000 30000D00 0A004F00 $.5...0.0.....O.
0x0000046C: 52004400 45005200 20004200 59002000 R.D.E.R. .B.Y. .
0x0000047C: 50007200 6F006400 75006300 74004900 P.r.o.d.u.c.t.I.
0x0000048C: 44002C00 20004C00 69006E00 65005400 D.,. .L.i.n.e.T.
0x0000049C: 6F007400 61006C00 3B000D00 0A003C00 o.t.a.l.;.....<. 0x000004AC: 2F004300 4D004400 3E000D00 0A003C00 /.C.M.D.>.....<. 0x000004BC: 2F004C00 41004E00 47003E00 0D000A00 /.L.A.N.G.>.....
0x000004CC:

11/20/12 12:30:39.010 [0x00001040] File C:\RML\SQL00063.rml: Parser Error: [Error: 110010][State: 100][Abs Char: 1068][Seq: 0] SYNTAX ERROR: Parser is unable to safely recover. Correct the errors and try again.
The error suggests that the two formats are indeed more different than I supposed, thus making the replay with Ostress a bit unrealiable.
Are there other options?
Sure there are! Profiler is another tool that allows replaying the workload, even if some limitations apply. For instance, Profiler cannot be scripted, which is a huge limitation if you are using Ostress in benchmarking script and want to replace it with something else.
That “something else” could actually be the Distributed Replay feature introduced in SQL Server 2012.
Basically, Distributed Replay does the same things that Ostress does and even more, with the nice addition of the possibility to start the replay on multiple machines, thus simulating a workload that resembles more the one found in production.
An introduction to Distributed Replay can be found on Jonathan Kehayias’ blog and I will refrain from going into deep details here: those posts are outstanding and there’s very little I could add to that.
Installing the Distributed Replay feature
The first step for the installation is adding a new user for the distributed replay services. You could actually use separate accounts for the Controller and Client services, but for a quick demo a single user is enough.
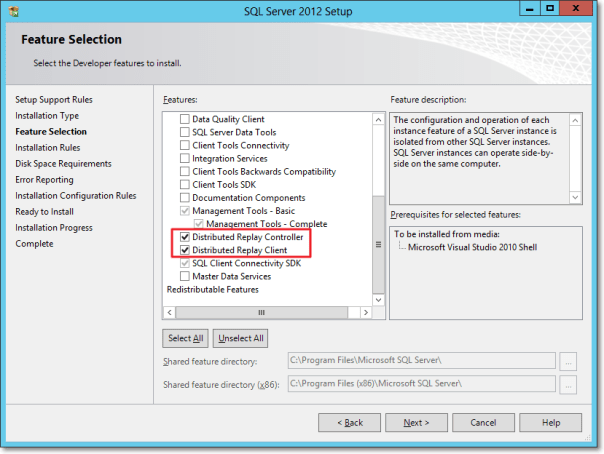
The Distributed Replay Controller and Client features must be selected from the Feature Selection dialog of SQLServer setup:
In the next steps of the setup you will also be asked the service accounts to use for the services and on the Replay Client page you will have to enter the controller name and the working directories.
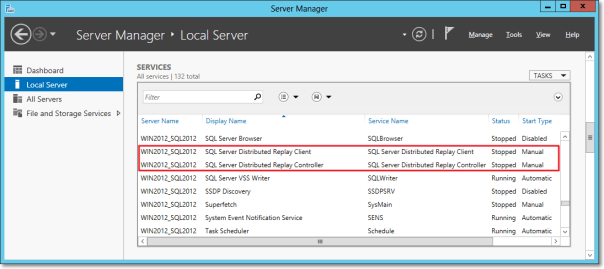
Once the setup is over, you will find two new services in the Server Manager:
After starting the services (first the Controller, then the Client), you can go to the log directories and check in the log files if everything is working.
The two files to check are in the following folders:
- C:\Program Files (x86)\Microsoft SQL Server\110\Tools\DReplayController\Log
- C:\Program Files (x86)\Microsoft SQL Server\110\Tools\DReplayClient\Log
Just to prove one more time that “if something can wrong, it will”, the client log will probably contain an obnoxious error message.
DCOM gotchas
Setting up the distributed replay services can get tricky because of some permissions needed to let the client connect to the controller. Unsurprisingly, the client/controller communication is provided by DCOM, which must be configured correctly.
Without granting the appropriate permissions, in the distributed replay client log file you may find the following message:
2012-11-03 00:43:04:062 CRITICAL [Client Service] [0xC8100005 (6)] Failed to connect controller with error code 0x80070005.
In practical terms, the service account that executes the distributed replay controller service must be granted permissions to use the DCOM class locally and through the network:
- Run dcomcnfg.exe
- Navigate the tree to Console Root, Component Services, Computers, My Computer, DCOM Config, DReplayController
- Right click DReplayController and choose “properties” from the context menu.
- Click the Security tab
- Click the “Launch and Activation Permissions” edit button and grant “Local Activation” and “Remote Activation” permissions to the service account
- Click the “Access Permissions” edit button and grant “Local Access” and “Remote Access” permissions to the service account
- Add the service user account to the “Distributed COM Users” group
- Restart the distributed replay controller and client services
After restarting the services, you will find that the message in the log file has changed:
2012-11-20 14:01:10:783 OPERATIONAL [Client Service] Registered with controller "WIN2012_SQL2012".
Using the Replay feature
Once the services are successfully started, we can now start using the Distributed Replay feature.
The trace file has to meet the same requirements for replay found in Profiler, thus making the “Replay” trace template suitable for the job.
But there’s one more step needed before we can replay the trace file, which cannot be replayed directly. In fact, distributed replay needs to work on a trace stub, obtained preprocessing the original trace file.
The syntax to obtain the stub is the following:
"C:\Program Files (x86)\Microsoft SQL Server\110\Tools\Binn\dreplay.exe" preprocess -i "C:\SomePath\replay_trace.trc" -d "C:\SomePath\preprocessDir"
Now that the trace stub is ready, we can start the replay admin tool from the command line, using the following syntax:
"C:\Program Files (x86)\Microsoft SQL Server\110\Tools\Binn\dreplay.exe" replay -s "targetServerName" -d "C:\SomePath\preprocessDir" -w "list,of,allowed,client,names"
A final word
A comparison of the features found in the different replay tools can be found in the following table:
| Profiler | Ostress | Distributed Replay | |
| Multithreading | YES | YES | YES |
| Debugging | YES | NO | NO |
| Synchronization mode | NO | YES | YES |
| Stress mode | YES | YES | YES |
| Distributed mode | NO | NO | YES |
| Scriptable | NO | YES | YES |
| Input format | Trace | Trace/RML/SQL | Trace |
The Distributed Replay Controller can act as a replacement for Ostress, except for the ability to replay SQL and RML files.
Will we be using RML Utilities again in the future? Maybe: it depends on what Microsoft decides to do with this tool. It’s not unlikely that the Distributed Replay feature will replace the RML Utilities entirely. The tracing feature itself has an unceartain future ahead, with the deprecation in SQL Server 2012. Probably this new feature will disappear in the next versions of SQLServer, or it will be ported to the Extended Events instrastructure, who knows?
One thing is sure: today we have three tools that support replaying trace files and seeing this possibilty disappear in the future would be very disappointing. I’m sure SQL Server will never disappoint us. 🙂
More on converting Trace Files
Yesterday I posted a method to convert trace files from SQL Server 2012 to SQL Server 2008R2 using a trace table.
As already mentioned in that post, having to load the whole file into a trace table has many shortcomings:
- The trace file can be huge and loading it into a trace table could take forever
- The trace data will consume even more space when loaded into a SQL Server table
- The table has to be written back to disk in order to obtain the converted file
- You need to have Profiler 2008 in order to write a trace in the “old” format
- You need to have a SQL Server 2008 instance to dump the trace table back to the file, as Profiler 2008 won’t connect to a SQL Server 2012
That said, it would really be useful if the file could be updated in place, changing just the version byte…
No worries: PowerShell to the rescue!
## =============================================
## Author:      Gianluca Sartori - @spaghettidba
## Create date: 2012-11-07
## Description: Changes the version information
##              in the header of a SQL Server trace
## =============================================
cls

# Enter your filename here
$fileName = "somefile.trc"

# The version information we want to write: 0x0A = 10 = SQLServer 2008
[Byte[]] $versionData = 0x0A
# The offset of the version information in the file
$offset = 390

[System.IO.FileMode] $open = [System.IO.FileMode]::OpenOrCreate
$stream = New-Object System.IO.FileStream -ArgumentList $fileName, $open
$stream.Seek($offset, [System.IO.SeekOrigin]::Begin);
$stream.Write($versionData, 0, $versionData.Length);
$stream.Close()
This script overwrites the version byte in the trace file, which lies at offset 390, changing it from 11 to 10.
This way, even a huge 100 GB trace file can be converted in milliseconds, ready to be consumed by ReadTrace or Profiler.
Enjoy!
P.S.: I haven’t tried, but I guess it could work with previous versions. However, tracing is deprecated in SQL Server 2012 and I guess it doesn’t introduce many differences from the SQL Server 2008 trace file format. The same cannot be said for SQL Server 2005 and I suppose that the file wouldn’t open anyway in Profiler. Unfortunately, I don’t have a SQL Server 2005 around to test.
Convert a Trace File from SQLServer 2012 to SQLServer 2008R2
Recently I started using RML utilities quite a lot.
ReadTrace and Ostress are awesome tools for benchmarking and baselining and many of the features found there have not been fully implemented in SQLServer 2012, though Distributed Replay was a nice addition.
However, as you may have noticed, ReadTrace is just unable to read trace files from SQLServer 2012, so you may get stuck with a trace file you wont’ abe able to process.
When I first hit this issue, I immediately thought I could use a trace table to store the data and then use Profiler again to write back to a trace file.
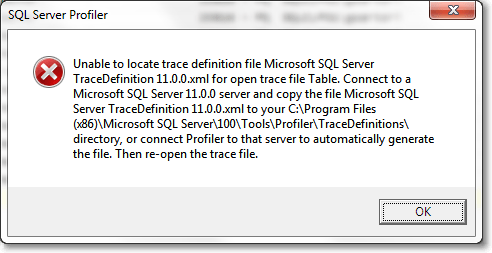
The idea wasn’t bad, but turns out that Profiler 2012 will always write trace files in the new format, with no way to specify the old one. On the other hand, Profiler2008R2 can’t read trace data from a table written by Profiler2012, throwing an ugly exception:
Interesting! So, looks like Profiler stores version information and other metadata somewhere in the trace table, but where exactly?
It might sound funny, but I had to trace Profiler with Profiler in order to know! Looking at the profiler trace, the first thing that Profiler does when trying to open a trace table is this:
declare @p1 int
set @p1=180150003
declare @p3 int
set @p3=2
declare @p4 int
set @p4=4
declare @p5 int
set @p5=-1
exec sp_cursoropen @p1 output,N'select BinaryData from [dbo].[trace_test] where RowNumber=0',@p3 output,@p4 output,@p5 output
select @p1, @p3, @p4, @p5
So, looks like Profiler stores its metadata in the first row (RowNumber = 0), in binary format.
That was the clue I was looking for!
I loaded a trace file in the old format into another trace table and I started to compare the data to find similarities and differences.
I decided to break the binary headers into Dwords and paste the results in WinMerge to hunt the differences:
-- Break the header row in the trace table into DWords
-- in order to compare easily in WinMerge
SELECT SUBSTRING(data, 8 * (n - 1) + 3, 8) AS dword
	,n AS dwordnum
FROM (
	SELECT CONVERT(VARCHAR(max), CAST(binarydata AS VARBINARY(max)), 1) AS data
	FROM tracetable
	WHERE rownumber = 0
	) AS src
INNER JOIN (
	SELECT DISTINCT ROW_NUMBER() OVER (
			ORDER BY (SELECT NULL)
		) / 8 AS n
	FROM sys.all_columns AS ac
	) AS v
	ON n > 0 AND (n - 1) * 8 <= LEN(data) - 3
ORDER BY 2
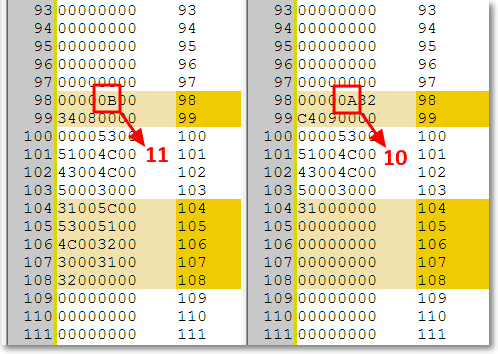
If you copy/paste the output in WinMerge you can easily spot the difference around the 100th dword:
Hmmmm, seems promising. Can those “11” and “10” possibly represent the trace version? Let’s try and see.
Now we should just update that section of the header to let the magic happen:
-- Use a table variable to cast the trace
-- header from image to varbinary(max)
DECLARE @header TABLE (
	header varbinary(max)
)

-- insert the trace header into the table
INSERT INTO @header
SELECT binarydata
FROM tracetable
WHERE RowNumber = 0

-- update the byte at offset 390 with version 10 (SQLServer 2008)
-- instead of version 11 (SQLServer 2012)
UPDATE @header
SET header .WRITE(0x0A,390,1)

-- write the header back to the trace table
UPDATE tracetable
SET binarydata = (SELECT header FROM @header)
WHERE RowNumber = 0
The trace table can now be opened with Profiler2008R2 and written back to a trace file. Hooray!
Yes, I know, using a trace table can take a whole lot of time and consume a lot of disk space when the file is huge (and typically RML traces are), but this is the best I could come up with.
I tried to look into the trace file itself, but I could not find a way to diff the binary contents in an editor. You may be smarter than me a give it a try: in that case, please, post a comment here.
Using this trick, ReadTrace can happily process the trace file and let you perform your benchmarks, at least until Microsoft decides to update RML Utilities to 2012.
UPDATE 11/08/2012: The use of a trace table is not necessary: the trace file can be updated in place, using the script found here.


