Data Collector Clustering Woes
During the last few days I’ve been struggling to work around something that seems to be a bug in SQL Server 2008 R2 Data Collector in a clustered environment. It’s been quite a struggle, so I decided to post my findings and my resolution, hoping I didn’t contend in vain.
SYMPTOMS:
After setting up a Utility Control Point, I started to enroll my instances to the UCP and everything was looking fine.

When an instance is enrolled to a UCP, the sysutility_mdw database can be used as a target Management Datawarehouse for non-utility collection sets, such as the built-in system collection sets. Actually, the utility database is the only possible target for any collection set, since the data collection configuration is shared between utility and non-utility collection sets.
That said, I enabled and started the system collection sets and eagerly waited for some data to show up on the built-in reports. As nothing turned up, I checked the data collector jobs and they were executing successfully, so the data had to be there, hidden somewhere.
In fact, the data had been collected and uploaded successfully, but it didn’t show up in the reports because of the way the data source had been registered in the Management Datawarehouse internal tables.
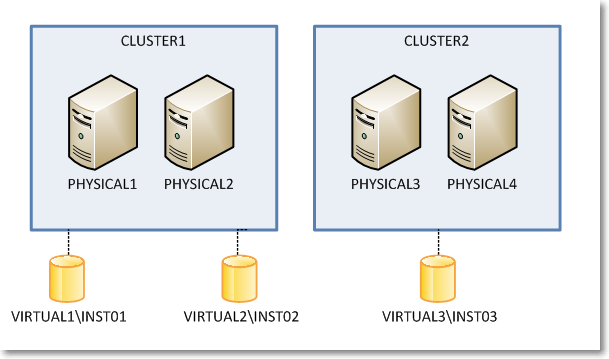
A quick look at [core].[source_info_internal] unveiled the root cause of the issue: the clustered instances had been registered with the physical name of the cluster node and not with the virtual server name of the instance.

The built-in Data Collector reports filter data in this table using the server name connected in SSMS, which is obviously very different from what found in the data sources table. For instance, when connected to the clustered instance VIRTUAL1\INST01, I didn’t see any performance data showing in the report because the data had been collected using the physical network name of the owner node (eg. PHYSICAL1\INST01).
I know it may sound confusing at this point, so keep the following picture in mind while looking at servers and instances in the example.
So, what was wrong with my setup? How could it be fixed?
I tried everything that came to my mind to no avail. In order, I tried:
- Wiping out the datawarehouse database (sysutility_mdw)
- Reinstalling the instance hosting the datawarehouse
- Changing the upload jobs (this one looked promising, because some job steps contained the $(MACH)\$(INST) tokens instead of the $(SRVR) token I would have expected, but it didn’t work either)
- Updating data in the tables directly
Nothing I tried solved the issue: every time the upload jobs ran at the enrolled instances, the wrong instance names turned up in the data sources table.
I suspect something was wrong in the Management Datawarehouse instance, since the same issue affected all the enrolled instances, no matter where they were installed. Question is I was unable to find a way to make it work.
The only thing that worked for me was forcing SQL Server to understand what my cluster setup looks like and preventing it from using cluster node names instead of virtual instance names.
As ugly as it can be, the only fix that worked was a view + INSTEAD OF TRIGGER combination.
First of all we need some tables to store the cluster layout, with nodes and instances.
-- Create a couple of tables in msdb to
-- describe the cluster topology
USE msdb;
GO

CREATE TABLE sysutility_ucp_managed_cluster_nodes (
    cluster_id int NOT NULL,
    node_name sysname NOT NULL PRIMARY KEY CLUSTERED
)
GO

CREATE TABLE sysutility_ucp_managed_cluster_servers (
    cluster_id int NOT NULL,
    virtual_server_name sysname NOT NULL PRIMARY KEY CLUSTERED,
    instance_name sysname NULL,
    server_name AS virtual_server_name + ISNULL('\' + NULLIF(instance_name,'MSSQLSERVER'),'')
)
GO

INSERT INTO sysutility_ucp_managed_cluster_nodes (cluster_id, node_name)
VALUES	(1,'PHYSICAL1'),
        (1,'PHYSICAL2'),
        (2,'PHYSICAL3'),
        (2,'PHYSICAL4')
GO

INSERT INTO sysutility_ucp_managed_cluster_servers (cluster_id, virtual_server_name, instance_name)
VALUES	(1,'VIRTUAL1','INST01'),
        (1,'VIRTUAL2','INST02'),
        (2,'VIRTUAL3','INST03')

GO

GRANT SELECT ON object::sysutility_ucp_managed_cluster_nodes TO [dc_proxy];
GRANT SELECT ON object::sysutility_ucp_managed_cluster_servers TO [dc_proxy];
Then we need to update the data sources collected using the cluster node name instead of the virtual name:
USE [sysutility_mdw]
GO

UPDATE trg
SET trg.instance_name = REPLACE(trg.instance_name COLLATE database_default, nodes.node_name + '\', srv.virtual_server_name + '\')
FROM [core].[source_info_internal] AS trg
INNER JOIN msdb.dbo.sysutility_ucp_managed_cluster_nodes AS nodes
    ON nodes.node_name = SUBSTRING(trg.instance_name, 1, LEN(nodes.node_name)) COLLATE database_default
INNER JOIN msdb.dbo.sysutility_ucp_managed_cluster_servers AS srv
    ON nodes.cluster_id = srv.cluster_id

-- Now server names should be ok
SELECT *
FROM sysutility_mdw.[core].[source_info_internal]
GO
Now we will replace the data sources table with a view that multiplies virtual server names for each possible owner node. This is required because the collection sets keep trying to upload data using the cluster node name and they fail miserably when the data source is not found in the table (“the specified collection set is not valid in this data warehouse”)
USE [sysutility_mdw]
GO

-- Rename the data sources table
EXEC sp_rename 'core.source_info_internal', 'source_info_internal_ms'

USE [sysutility_mdw]
GO

SET ANSI_NULLS ON
GO

SET QUOTED_IDENTIFIER ON
GO

CREATE VIEW [core].[source_info_internal]
AS
SELECT sii.source_id
    ,sii.collection_set_uid
    ,instance_name = (nds.node_name + ISNULL('\' + NULLIF(srv.instance_name,'MSSQLSERVER'),'')) COLLATE Latin1_General_CI_AI
    ,sii.days_until_expiration
    ,sii.operator
FROM core.source_info_internal_ms AS sii
INNER JOIN msdb.dbo.sysutility_ucp_managed_cluster_servers AS srv
    ON sii.instance_name COLLATE database_default = srv.server_name
INNER JOIN msdb.dbo.sysutility_ucp_managed_cluster_nodes AS nds
    ON nds.cluster_id = srv.cluster_id
UNION ALL
SELECT *
FROM core.source_info_internal_ms

GO
And now the last thing we need to create is a trigger on the view, in order to control what gets written to the original table.
With this in place, we should have only “good” server names showing up in the instance_name column.
CREATE TRIGGER [core].[TR_source_info_internal_IU]
ON [core].[source_info_internal]
INSTEAD OF INSERT, UPDATE, DELETE
AS
BEGIN
    SET NOCOUNT ON;

    -- Update rows using the source_id
    UPDATE trg
    SET days_until_expiration = i.days_until_expiration
    FROM core.source_info_internal_ms AS trg
    INNER JOIN inserted AS i
        ON trg.source_id = i.source_id
    WHERE EXISTS (
        SELECT 1
        FROM deleted
        WHERE source_id = i.source_id
    )

    -- Turn INSERTs into UPDATEs using the
    -- cluster physical / virtual conversion
    UPDATE trg
    SET days_until_expiration = i.days_until_expiration
    FROM core.source_info_internal_ms AS trg
    INNER JOIN msdb.dbo.sysutility_ucp_managed_cluster_servers AS srv
        ON srv.server_name = trg.instance_name COLLATE database_default
    INNER JOIN msdb.dbo.sysutility_ucp_managed_cluster_nodes AS nodes
        ON nodes.cluster_id = srv.cluster_id
    INNER JOIN inserted AS i
        ON  trg.collection_set_uid = i.collection_set_uid
        AND trg.operator = i.operator
        AND nodes.node_name + ISNULL('\' + NULLIF(srv.instance_name,'MSSQLSERVER'),'') = i.instance_name COLLATE database_default
    WHERE NOT EXISTS (
        SELECT 1
        FROM deleted
        WHERE source_id = i.source_id
    )

    -- Handle proper INSERTs
    ;WITH newrows AS (
        SELECT collection_set_uid, v_server.instance_name, days_until_expiration, operator
        FROM inserted AS i
        CROSS APPLY (
            SELECT instance_name = COALESCE((
                    SELECT srv.server_name
                    FROM msdb.dbo.sysutility_ucp_managed_cluster_servers AS srv
                    INNER JOIN msdb.dbo.sysutility_ucp_managed_cluster_nodes AS nodes
                        ON nodes.cluster_id = srv.cluster_id
                    WHERE srv.server_name = i.instance_name COLLATE database_default
                ),(
                    SELECT srv.server_name
                    FROM msdb.dbo.sysutility_ucp_managed_cluster_servers AS srv
                    INNER JOIN msdb.dbo.sysutility_ucp_managed_cluster_nodes AS nodes
                        ON nodes.cluster_id = srv.cluster_id
                    WHERE nodes.node_name + ISNULL('\' + NULLIF(srv.instance_name,'MSSQLSERVER'),'') = i.instance_name COLLATE database_default
                ), (
                    SELECT i.instance_name COLLATE database_default
                )
            ) -- end coalesce
        ) AS v_server
        WHERE NOT EXISTS (
                SELECT 1
                FROM deleted
                WHERE source_id = i.source_id
            )
    )
    INSERT INTO core.source_info_internal_ms (collection_set_uid, instance_name, days_until_expiration, operator)
    SELECT collection_set_uid, instance_name, days_until_expiration, operator
    FROM newrows
    WHERE NOT EXISTS (
        SELECT 1
        FROM core.source_info_internal_ms
        WHERE collection_set_uid = newrows.collection_set_uid
            AND instance_name = newrows.instance_name
            AND operator = newrows.operator
    )

    DELETE trg
    FROM core.source_info_internal_ms AS trg
    WHERE EXISTS (
            SELECT 1
            FROM deleted
            WHERE source_id = trg.source_id
        )
        AND NOT EXISTS (
            SELECT 1
            FROM inserted
            WHERE source_id = trg.source_id
        )

END
Obviously I don’t have access to the source code of the Data Collector, but I suspect it uses a component which is not cluster-aware (dcexec.exe) and for some reason it ends up using the wrong IP address to communicate with the management datawarehouse. I have nothing to support my supposition: it only seems reasonable to me and it resembles something I experienced in the past with non-cluster-aware services, such as the SQL Browser.
Is this a bug? Definitely!
Should I report it on Connect? Maybe: the results with past items are so discouraging that I don’t think I’ll bother taking the time to file it. It must be said that reproducing this error is not easy: any other failover cluster instance I have laying around was not affected by this issue, so I guess it’s an edge case. Nevertheless, worth fixing.
UPDATE 15 sept 2016:
Turns out that the whole problem arises ONLY when a proxy account runs the data collection job steps. If the job steps are run impersonating the SQL Server Agent account, the error doesn’t turn up. I suggest this solution rather than the complicated view/trigger solution proposed here.
dba_runCHECKDB v2(012)
If you are one among the many that downloaded my consistency check stored procedure called “dba_RunCHECKDB”, you may have noticed a “small” glitch… it doesn’t work on SQL Server 2012!
This is due to the resultset definition of DBCC CHECKDB, which has changed again in SQL Server 2012. Trying to pipe the results of that command in the table definition for SQL Server 2008 produces a column mismatch and it obviously fails.
Fixing the code is very easy indeed, but I could never find the time to post the corrected version until today.
Also, I had to discover the new table definition for DBCC CHECKDB, and it was not just as easy as it used to be in SQL Server 2008. In fact, a couple of days ago I posted a way to discover the new resultset definition working around the cumbersome metadata discovery feature introduced in SQL Server 2012.
Basically, the new output of DBCC CHECKDB now includes 6 new columns:
    CREATE TABLE ##DBCC_OUTPUT(
        Error int NULL,
        [Level] int NULL,
        State int NULL,
        MessageText nvarchar(2048) NULL,
        RepairLevel nvarchar(22) NULL,
        Status int NULL,
        DbId int NULL, -- was smallint in SQL2005
        DbFragId int NULL,      -- new in SQL2012
        ObjectId int NULL,
        IndexId int NULL,
        PartitionId bigint NULL,
        AllocUnitId bigint NULL,
        RidDbId smallint NULL,  -- new in SQL2012
        RidPruId smallint NULL, -- new in SQL2012
        [File] smallint NULL,
        Page int NULL,
        Slot int NULL,
        RefDbId smallint NULL,  -- new in SQL2012
        RefPruId smallint NULL, -- new in SQL2012
        RefFile smallint NULL,  -- new in SQL2012
        RefPage int NULL,
        RefSlot int NULL,
        Allocation smallint NULL
    )
If you Google the name of one of these new columns, you will probably find a lot of blog posts (no official documentation, unfortunately) that describes the new output of DBCC CHECKDB, but none of them is strictly correct: all of them indicate the smallint columns as int.
Not a big deal, actually, but still incorrect.
I will refrain from posting the whole procedure here: I updated the code in the original post, that you can find clicking here. You can also download the code from the Code Repository.
As usual, suggestions and comments are welcome.
Discovering resultset definition of DBCC commands in SQL Server 2012
Back in 2011 I showed a method to discover the resultset definition of DBCC undocumented commands.
At the time, SQL Server 2012 had not been released yet and nothing suggested that the linked server trick could stop working on the new major version. Surprisingly enough it did.
If you try to run the same code showed in that old post on a 2012 instance, you will get a quite explicit error message:
DECLARE @srv nvarchar(4000);
SET @srv = @@SERVERNAME; -- gather this server name

-- Create the linked server
EXEC master.dbo.sp_addlinkedserver
    @server     = N'LOOPBACK',
    @srvproduct = N'SQLServ', -- it’s not a typo: it can’t be “SQLServer”
    @provider   = N'SQLNCLI', -- change to SQLOLEDB for SQLServer 2000
    @datasrc    = @srv;

-- Set the authentication to "current security context"
EXEC master.dbo.sp_addlinkedsrvlogin
    @rmtsrvname  = N'LOOPBACK',
    @useself     = N'True',
    @locallogin  = NULL,
    @rmtuser     = NULL,
    @rmtpassword = NULL;

USE tempdb;
GO

CREATE PROCEDURE loginfo
AS
BEGIN
    SET NOCOUNT ON;

    DBCC LOGINFO();
END
GO

SELECT *
INTO tempdb.dbo.loginfo_output
FROM OPENQUERY(LOOPBACK, 'SET FMTONLY OFF; EXEC tempdb.dbo.loginfo');

DROP PROCEDURE loginfo;
GO
Msg 11528, Level 16, State 1, Procedure sp_describe_first_result_set, Line 1
The metadata could not be determined because statement 'DBCC LOGINFO();' in procedure 'loginfo' does not support metadata discovery.
This behaviour has to do with the way SQL Server 2012 tries to discover metadata at parse/bind time, when the resultset is not available yet for DBCC commands.
Fortunately, there is still a way to discover metadata when you have a SQL Server instance of a previous version available.
On my laptop I have a 2008R2 instance I can use to query the 2012 instance with a linked server:
-- run this on the 2008R2 instance
USE [master]
GO

EXEC master.dbo.sp_addlinkedserver
     @server = N'LOCALHOST\SQL2012'
    ,@srvproduct = N'SQL Server'

EXEC master.dbo.sp_addlinkedsrvlogin
     @rmtsrvname = N'LOCALHOST\SQL2012'
    ,@useself = N'True'
    ,@locallogin = NULL
    ,@rmtuser = NULL
    ,@rmtpassword = NULL
GO

SELECT *
INTO tempdb.dbo.loginfo_output
FROM OPENQUERY([LOCALHOST\SQL2012], 'SET FMTONLY OFF; EXEC tempdb.dbo.loginfo');
GO
This code pipes the results of the DBCC command into a table in the tempdb database in my 2008R2 instance. The table can now be scripted using SSMS:

Using the 2008R2 instance as a “Trojan Horse” for the metadata discovery, you can see that the resultset definition of DBCC LOGINFO() has changed again in SQL Server 2012:
CREATE TABLE [dbo].[loginfo_output](
	[RecoveryUnitId] [int] NULL,  -- new in SQL2012
	[FileId] [int] NULL,
	[FileSize] [bigint] NULL,
	[StartOffset] [bigint] NULL,
	[FSeqNo] [int] NULL,
	[Status] [int] NULL,
	[Parity] [tinyint] NULL,
	[CreateLSN] [numeric](25, 0) NULL
)
This trick will be particularly useful for an upcoming (and long overdue) post, so… stay tuned!
Extracting DACPACs from all databases with Powershell
If you are adopting Sql Server Data Tools as your election tool to maintain database projects under source control and achieve an ALM solution, at some stage you will probably want to import all your databases in SSDT.
Yes, it can be done by hand, one at a time, using either the “import live database” or “schema compare” features, but what I have found to be more convenient is the “import dacpac” feature.
Basically, you can extract a dacpac from a live database and then import it in SSDT, entering some options in the import dialog.
The main reason why I prefer this method is the reduced amount of manual steps involved. Moreover, the dacpac extraction process can be fully automated using sqlpackage.exe.
Recently I had to import a lot of databases in SSDT and found that sqlpackage can be used in a PowerShell script to automate the process even further:
#
# Extract DACPACs from all databases
#
# Author: Gianluca Sartori - @spaghettidba
# Date:   2013/02/13
# Purpose:
# Loop through all user databases and extract
# a DACPAC file in the working directory
#
#

Param(
    [Parameter(Position=0,Mandatory=$true)]
    [string]$ServerName
)

cls

try {
    if((Get-PSSnapin -Name SQlServerCmdletSnapin100 -ErrorAction SilentlyContinue) -eq $null){
        Add-PSSnapin SQlServerCmdletSnapin100
    }
}
catch {
    Write-Error "This script requires the SQLServerCmdletSnapIn100 snapin"
    exit
}

#
# Gather working directory (script path)
#
$script_path = Split-Path -Parent $MyInvocation.MyCommand.Definition

$sql = "
    SELECT name
    FROM sys.databases
    WHERE name NOT IN ('master', 'model', 'msdb', 'tempdb','distribution')
"

$data = Invoke-sqlcmd -Query $sql -ServerInstance $ServerName -Database master

$data | ForEach-Object {

    $DatabaseName = $_.name

    #
    # Run sqlpackage
    #
    &"C:\Program Files (x86)\Microsoft SQL Server\110\DAC\bin\sqlpackage.exe" `
        /Action:extract `
        /SourceServerName:$ServerName `
        /SourceDatabaseName:$DatabaseName `
        /TargetFile:$script_path\DACPACs\$DatabaseName.dacpac `
        /p:ExtractReferencedServerScopedElements=False `
        /p:IgnorePermissions=False

}
It’s a very simple script indeed, but it saved me a lot of time and I wanted to share it with you.
Unfortunately, there is no way to automate the import process in SSDT, but looks like Microsoft is actually looking into making this feature availabe in a future version.
Using QUERYTRACEON in plan guides
Yesterday the CSS team made the QUERYTRACEON hint publicly documented.
This means that now it’s officially supported and you can use it in production code.
After reading the post on the CSS blog, I started to wonder whether there is some actual use in production for this query hint, given that it requires the same privileges as DBCC TRACEON, which means you have to be a member of the sysadmin role.
In fact, if you try to use that hint when connected as a low privileged user, you get a very precise error message, that leaves no room for interpretation:
SELECT *
FROM [AdventureWorks2012].[Person].[Person]
OPTION (QUERYTRACEON 4199)
Msg 2571, Level 14, State 3, Line 1
User ‘guest’ does not have permission to run DBCC TRACEON.
How can a query hint available to sysadmins only be possibly useful for production?
I posted my doubt on Twitter using the #sqlhelp hashtag and got interesting replies from Paul Randal, Paul White and Robert Davis.
My concerns were not about the usefulness of the hint per se, but about the usefulness in production code. Often 140 chars are not enough when you want to express your thoughts clearly, in fact I decided to write this blog post to clarify what I mean.
As we have seen, the QUERYTRACEON query hint cannot be used directly by users not in the sysadmin role, but it can be used in stored procedures with “EXECUTE AS owner” and in plan guides.
While it’s completely clear what happens when the hint is used in procedures executed in the context of the owner, what happens in plan guides is not so obvious (at least, not to me). In fact, given that the secuirty context is not changed when the plan guide is matched and applied, I would have expected it to fail miserably when executed by a low privileged user, but it’s not the case.
Let’s try and see what happens:
First of all we need a query “complex enough” to let the optimizer take plan guides into account. A straight “SELECT * FROM table” and anything else that results in a trivial plan won’t be enough.
SELECT *
FROM [Person].[Person] AS P
INNER JOIN [Person].[PersonPhone] AS H
    ON P.BusinessEntityID = H.BusinessEntityID
INNER JOIN [Person].[BusinessEntity] AS BE
    ON P.BusinessEntityID = BE.BusinessEntityID
INNER JOIN [Person].[BusinessEntityAddress] AS BEA
    ON BE.BusinessEntityID = BEA.BusinessEntityID
WHERE BEA.ModifiedDate > '20080101'
Then we need a plan guide to apply the QUERYTRACEON hint:
EXEC sp_create_plan_guide @name = N'[querytraceon]', @stmt = N'SELECT *
FROM [Person].[Person] AS P
INNER JOIN [Person].[PersonPhone] AS H
	ON P.BusinessEntityID = H.BusinessEntityID
INNER JOIN [Person].[BusinessEntity] AS BE
	ON P.BusinessEntityID = BE.BusinessEntityID
INNER JOIN [Person].[BusinessEntityAddress] AS BEA
	ON BE.BusinessEntityID = BEA.BusinessEntityID
WHERE BEA.ModifiedDate > ''20080101''', @type = N'SQL', @hints = N'OPTION (QUERYTRACEON 4199)'
If we enable the plan guide and try to issue this query in the context of a low privileged user, we can see no errors thrown any more:
CREATE LOGIN testlogin WITH PASSWORD = 'testlogin123';
GO
USE AdventureWorks2012;
GO
CREATE USER testlogin FOR LOGIN testlogin;
GO
GRANT SELECT TO testlogin;
GO
EXECUTE AS USER = 'testlogin';
GO
SELECT *
FROM [Person].[Person] AS P
INNER JOIN [Person].[PersonPhone] AS H
    ON P.BusinessEntityID = H.BusinessEntityID
INNER JOIN [Person].[BusinessEntity] AS BE
    ON P.BusinessEntityID = BE.BusinessEntityID
INNER JOIN [Person].[BusinessEntityAddress] AS BEA
    ON BE.BusinessEntityID = BEA.BusinessEntityID
WHERE BEA.ModifiedDate > '20080101';
GO
REVERT;
GO
If we open a profiler trace and capture the “Plan Guide Successful” and “Plan Guide Unsuccessful” events, we can see that the optimizer matches the plan guide and enforces the use of the query hint.
Lesson learned: even if users are not allowed to issue that particular query hint directly, adding it to a plan guide is a way to let anyone use it indirectly.
Bottom line is OPTION QUERYTRACEON can indeed be very useful when we identify some queries that obtain a decent query plan only when a specific trace flag is active and we don’t want to enable it for the whole instance. In those cases, a plan guide or a stored procedure in the owner’s context can be the answer.
Manual Log Shipping with PowerShell
Recently I had to implement log shipping as a HA strategy for a set of databases which were originally running under the simple recovery model.
Actually, the databases were subscribers for a merge publication, which leaves database mirroring out of the possible HA options. Clustering was not an option either, due to lack of shared storage at the subscribers.
After turning all databases to full recovery model and setting up log shipping, I started to wonder if there was a better way to implement it. Log shipping provides lots of flexibility, which I didn’t need: I just had to ship the transaction log from the primary to a single secondary and have transaction logs restored immediately. Preserving transaction log backups was not needed, because the secondary database was considered a sufficient backup in this case.
Another thing that I observed was the insane amount of memory consumed by SQLLogShip.exe (over 300 MB), which ended up even failing due to OutOfMemoryException at times.
After reading Edwin Sarmiento‘s fine chapter on SQL Server MVP Deep Dives “The poor man’s SQL Server log shipping”, some ideas started to flow.
First of all I needed a table to hold the configuration for my manual log shipping:
-- =============================================
-- Author:      Gianluca Sartori - @spaghettidba
-- Create date: 2013-02-07
-- Description: Creates a table to hold manual
--              log shipping configuration
-- =============================================

CREATE TABLE msdb.dbo.ManualLogShippingConfig (
    secondary sysname PRIMARY KEY CLUSTERED, -- Name of the secondary SQL Server instance
    sharedBackupFolder varchar(255),         -- UNC path to the backup path on the secondary
    remoteBackupFolder varchar(255)          -- Path to the backup folder on the secondary
                                             -- It's the same path as sharedBackupFolder,
                                             -- as seen from the secondary server
)
GO

INSERT INTO msdb.dbo.ManualLogShippingConfig (
    secondary,
    sharedBackupFolder,
    remoteBackupFolder
)
VALUES (
    'SomeServer',
    '\\SomeShare',
    'Local path of SomeShare on secondary'
)
GO
And then I just needed a PowerShell script to do the heavy lifting.
I think the code is commented and readable enough to show what happens behind the scenes.
## =============================================
## Author:      Gianluca Sartori - @spaghettidba
## Create date: 2013-02-07
## Description: Ships the log to a secondary server
## =============================================
sl c:\
$ErrorActionPreference = "Stop"

$primary = "$(ESCAPE_DQUOTE(SRVR))"

#
# Read Configuration from the table in msdb
#

$SQL_Config = @"
    SELECT * FROM msdb.dbo.ManualLogShippingConfig
"@

$info = Invoke-sqlcmd -Query $SQL_Config -ServerInstance $primary

$secondary = $info.secondary
$sharedFolder = $info.sharedBackupFolder
$remoteSharedFolder = $info.remoteBackupFolder

$ts = Get-Date -Format yyyyMMddHHmmss

#
# Read default backup path of the primary from the registry
#

$SQL_BackupDirectory = @"
    EXEC master.dbo.xp_instance_regread
        N'HKEY_LOCAL_MACHINE',
        N'Software\Microsoft\MSSQLServer\MSSQLServer',
        N'BackupDirectory'
"@

$info = Invoke-sqlcmd -Query $SQL_BackupDirectory -ServerInstance $primary

$BackupDirectory = $info.Data

#
# Ship the log of all databases in FULL recovery model
# You can change this to ship a single database's log
#

$SQL_FullRecoveryDatabases = @"
    SELECT name
    FROM master.sys.databases
    WHERE recovery_model_desc = 'FULL'
        AND name NOT IN ('master', 'model', 'msdb', 'tempdb')
"@

$info = Invoke-sqlcmd -Query $SQL_FullRecoveryDatabases -ServerInstance $primary

$info | ForEach-Object {

    $DatabaseName = $_.Name

    Write-Output "Processing database $DatabaseName"

    $BackupFile = $DatabaseName + "_" + $ts + ".trn"
    $BackupPath = Join-Path $BackupDirectory $BackupFile
    $RemoteBackupPath = Join-Path $remoteSharedFolder $BackupFile

    $SQL_BackupDatabase = "BACKUP LOG $DatabaseName TO DISK='$BackupPath' WITH INIT;"

    $SQL_NonCopiedBackups = "
        SELECT physical_device_name
        FROM msdb.dbo.backupset AS BS
        INNER JOIN msdb.dbo.backupmediaset AS BMS
            ON BS.media_set_id = BMS.media_set_id
        INNER JOIN msdb.dbo.backupmediafamily AS BMF
            ON BMS.media_set_id = BMF.media_set_id
        WHERE BS.database_name = '$DatabaseName'
            AND BS.type = 'L'
            AND expiration_date IS NULL
        ORDER BY BS.backup_start_date
    "

    #
    # Backup log to local path
    #
    Invoke-Sqlcmd -Query $SQL_BackupDatabase -ServerInstance $primary -QueryTimeout 65535

    Write-Output "LOG backed up to $BackupPath"

    #
    # Query noncopied backups...
    #
    $nonCopiedBackups = Invoke-Sqlcmd -Query $SQL_NonCopiedBackups -ServerInstance $primary

    $nonCopiedBackups | ForEach-Object {

        $BackupPath = $_.physical_device_name

        $BackupFile = Split-Path $BackupPath -Leaf

        $RemoteBackupPath = Join-Path $remoteSharedFolder $BackupFile

        $SQL_RestoreDatabase = "
            RESTORE LOG $DatabaseName
            FROM DISK='$RemoteBackupPath'
            WITH NORECOVERY;
        "

        $SQL_ExpireBackupSet = "
            UPDATE BS
            SET expiration_date = GETDATE()
            FROM msdb.dbo.backupset AS BS
            INNER JOIN msdb.dbo.backupmediaset AS BMS
                ON BS.media_set_id = BMS.media_set_id
            INNER JOIN msdb.dbo.backupmediafamily AS BMF
                ON BMS.media_set_id = BMF.media_set_id
            WHERE BS.database_name = '$DatabaseName'
                AND BS.type = 'L'
                AND physical_device_name = '$BackupPath'
        "

        #
        # Move the transaction log backup to the secondary
        #
        if (Test-Path $BackupPath) {
            Write-Output "Moving $BackupPath to $sharedFolder"
            Move-Item -Path ("Microsoft.PowerShell.Core\FileSystem::" + $BackupPath) -Destination ("Microsoft.PowerShell.Core\FileSystem::" + $sharedFolder) -Force
        }

        #
        # Restore the backup on the secondary
        #
        Invoke-Sqlcmd -Query $SQL_RestoreDatabase -ServerInstance $secondary -QueryTimeout 65535
        Write-Output "Restored LOG from $RemoteBackupPath"

        #
        # Delete the backup file
        #
        Write-Output "Deleting $RemoteBackupPath"
        Remove-Item $RemoteBackupPath -ErrorAction SilentlyContinue

        #
        # Mark the backup as expired
        #
        Write-Output "Expiring backup set $BackupPath"
        Invoke-Sqlcmd -Query $SQL_ExpireBackupSet -ServerInstance $primary

    }
}
The script can be used in a SQLAgent PowerShell job step and it’s all you need to start shipping your transaction logs.
Obviously, you need to take a full backup on the primary server and restore it to the secondary WITH NORECOVERY.
Once you’re ready, you can schedule the job to ship the transaction logs.
Do you need sysadmin rights to backup a database?
 Looks like a silly question, doesn’t it? – Well, you would be surprised to know it’s not.
Obviously, you don’t need to be a sysadmin to simply issue a BACKUP statement. If you look up the BACKUP statement on BOL you’ll see in the “Security” section that
BACKUP DATABASE and BACKUP LOG permissions default to members of the sysadmin fixed server role and the db_owner and db_backupoperator fixed database roles.
But there’s more to it than just permissions on the database itself: in order to complete successfully, the backup device must be accessible:
[…] SQL Server must be able to read and write to the device; the account under which the SQL Server service runs must have write permissions. […]
While this statement sound sensible or even obvious when talking about file system devices, with other types of device it’s less obvious what “permissions” means. With other types of device I mean tapes and Virtual Backup Devices. Since probably nobody uses tapes directly anymore, basically I’m referring to Virtual Backup Devices.
VDI (Virtual Backup device Interface) is the standard API intended for use by third-party backup software vendors to perform backup operations. Basically, it allows an application to act as a storage device.
The VDI specification is available here (you just need the vbackup.chm help file contained in the self-extracting archive).
If you download and browse the documentation, under the “Security” topic, you will find a worrying statement:
The server connection for SQL Server that is used to issue the BACKUP or RESTORE commands must be logged in with the sysadmin fixed server role.
Wait, … what???!?!??!! Sysadmin???????
Sad but true, sysadmin is the only way to let an application take backups using the VDI API. There is no individual permission you can grant: it’s sysadmin or nothing.
Since most third-party backup sofwares rely on the VDI API, this looks like a serious security flaw: every SQL Server instance around the world that uses third-party backup utilities has a special sysadmin login used by the backup tool, or, even worse, the tool runs under the sa login.
In my opinion, this is an unacceptable limitation and I would like to see a better implementation in a future version, so I filed a suggestion on Connect.
If you agree with me, feel free to upvote and comment it.
Replaying Workloads with Distributed Replay
A couple of weeks ago I posted a method to convert trace files from the SQL Server 2012 format to the SQL Server 2008 format.
The trick works quite well and the trace file can be opened with Profiler or with ReadTrace from RML Utilities. What doesn’t seem to work just as well is the trace replay with Ostress (another great tool bundled in the RML Utilities).
For some reason, OStress refuses to replay the whole trace file and starts throwing lots of errors.
Some errors are due to the workload I was replaying (it contains CREATE TABLE statements and that can obviuosly work just the first time it is issued), but some others seem to be due to parsing errors, probably because of differences in the trace format between version 11 and 10.
11/20/12 12:30:39.008 [0x00001040] File C:\RML\SQL00063.rml: Parser Error: [Error: 60500][State: 1][Abs Char: 1068][Seq: 0] Syntax error [parse error, expecting `tok_RML_END_RPC'] encountered near
0x0000042C: 6C000D00 0A005700 48004500 52004500 l.....W.H.E.R.E.
0x0000043C: 20005500 6E006900 74005000 72006900  .U.n.i.t.P.r.i.
0x0000044C: 63006500 20002600 6C007400 3B002000 c.e. .&.l.t.;. .
0x0000045C: 24003500 2E003000 30000D00 0A004F00 $.5...0.0.....O.
0x0000046C: 52004400 45005200 20004200 59002000 R.D.E.R. .B.Y. .
0x0000047C: 50007200 6F006400 75006300 74004900 P.r.o.d.u.c.t.I.
0x0000048C: 44002C00 20004C00 69006E00 65005400 D.,. .L.i.n.e.T.
0x0000049C: 6F007400 61006C00 3B000D00 0A003C00 o.t.a.l.;.....<. 0x000004AC: 2F004300 4D004400 3E000D00 0A003C00 /.C.M.D.>.....<. 0x000004BC: 2F004C00 41004E00 47003E00 0D000A00 /.L.A.N.G.>.....
0x000004CC:

11/20/12 12:30:39.010 [0x00001040] File C:\RML\SQL00063.rml: Parser Error: [Error: 110010][State: 100][Abs Char: 1068][Seq: 0] SYNTAX ERROR: Parser is unable to safely recover. Correct the errors and try again.
The error suggests that the two formats are indeed more different than I supposed, thus making the replay with Ostress a bit unrealiable.
Are there other options?
Sure there are! Profiler is another tool that allows replaying the workload, even if some limitations apply. For instance, Profiler cannot be scripted, which is a huge limitation if you are using Ostress in benchmarking script and want to replace it with something else.
That “something else” could actually be the Distributed Replay feature introduced in SQL Server 2012.
Basically, Distributed Replay does the same things that Ostress does and even more, with the nice addition of the possibility to start the replay on multiple machines, thus simulating a workload that resembles more the one found in production.
An introduction to Distributed Replay can be found on Jonathan Kehayias’ blog and I will refrain from going into deep details here: those posts are outstanding and there’s very little I could add to that.
Installing the Distributed Replay feature
The first step for the installation is adding a new user for the distributed replay services. You could actually use separate accounts for the Controller and Client services, but for a quick demo a single user is enough.

The Distributed Replay Controller and Client features must be selected from the Feature Selection dialog of SQLServer setup:

In the next steps of the setup you will also be asked the service accounts to use for the services and on the Replay Client page you will have to enter the controller name and the working directories.
Once the setup is over, you will find two new services in the Server Manager:

After starting the services (first the Controller, then the Client), you can go to the log directories and check in the log files if everything is working.
The two files to check are in the following folders:
- C:\Program Files (x86)\Microsoft SQL Server\110\Tools\DReplayController\Log
- C:\Program Files (x86)\Microsoft SQL Server\110\Tools\DReplayClient\Log
Just to prove one more time that “if something can wrong, it will”, the client log will probably contain an obnoxious error message.
DCOM gotchas
Setting up the distributed replay services can get tricky because of some permissions needed to let the client connect to the controller. Unsurprisingly, the client/controller communication is provided by DCOM, which must be configured correctly.
Without granting the appropriate permissions, in the distributed replay client log file you may find the following message:
2012-11-03 00:43:04:062 CRITICAL [Client Service] [0xC8100005 (6)] Failed to connect controller with error code 0x80070005.
In practical terms, the service account that executes the distributed replay controller service must be granted permissions to use the DCOM class locally and through the network:
- Run dcomcnfg.exe
- Navigate the tree to Console Root, Component Services, Computers, My Computer, DCOM Config, DReplayController
- Right click DReplayController and choose “properties” from the context menu.
- Click the Security tab
- Click the “Launch and Activation Permissions” edit button and grant “Local Activation” and “Remote Activation” permissions to the service account
- Click the “Access Permissions” edit button and grant “Local Access” and “Remote Access” permissions to the service account
- Add the service user account to the “Distributed COM Users” group
- Restart the distributed replay controller and client services
After restarting the services, you will find that the message in the log file has changed:
2012-11-20 14:01:10:783 OPERATIONAL [Client Service] Registered with controller "WIN2012_SQL2012".
Using the Replay feature
Once the services are successfully started, we can now start using the Distributed Replay feature.
The trace file has to meet the same requirements for replay found in Profiler, thus making the “Replay” trace template suitable for the job.
But there’s one more step needed before we can replay the trace file, which cannot be replayed directly. In fact, distributed replay needs to work on a trace stub, obtained preprocessing the original trace file.
The syntax to obtain the stub is the following:
"C:\Program Files (x86)\Microsoft SQL Server\110\Tools\Binn\dreplay.exe" preprocess -i "C:\SomePath\replay_trace.trc" -d "C:\SomePath\preprocessDir"
Now that the trace stub is ready, we can start the replay admin tool from the command line, using the following syntax:
"C:\Program Files (x86)\Microsoft SQL Server\110\Tools\Binn\dreplay.exe" replay -s "targetServerName" -d "C:\SomePath\preprocessDir" -w "list,of,allowed,client,names"
A final word
A comparison of the features found in the different replay tools can be found in the following table:
| Profiler | Ostress | Distributed Replay | |
| Multithreading | YES | YES | YES |
| Debugging | YES | NO | NO |
| Synchronization mode | NO | YES | YES |
| Stress mode | YES | YES | YES |
| Distributed mode | NO | NO | YES |
| Scriptable | NO | YES | YES |
| Input format | Trace | Trace/RML/SQL | Trace |
The Distributed Replay Controller can act as a replacement for Ostress, except for the ability to replay SQL and RML files.
Will we be using RML Utilities again in the future? Maybe: it depends on what Microsoft decides to do with this tool. It’s not unlikely that the Distributed Replay feature will replace the RML Utilities entirely. The tracing feature itself has an unceartain future ahead, with the deprecation in SQL Server 2012. Probably this new feature will disappear in the next versions of SQLServer, or it will be ported to the Extended Events instrastructure, who knows?
One thing is sure: today we have three tools that support replaying trace files and seeing this possibilty disappear in the future would be very disappointing. I’m sure SQL Server will never disappoint us. 🙂
More on converting Trace Files
Yesterday I posted a method to convert trace files from SQL Server 2012 to SQL Server 2008R2 using a trace table.
As already mentioned in that post, having to load the whole file into a trace table has many shortcomings:
- The trace file can be huge and loading it into a trace table could take forever
- The trace data will consume even more space when loaded into a SQL Server table
- The table has to be written back to disk in order to obtain the converted file
- You need to have Profiler 2008 in order to write a trace in the “old” format
- You need to have a SQL Server 2008 instance to dump the trace table back to the file, as Profiler 2008 won’t connect to a SQL Server 2012
That said, it would really be useful if the file could be updated in place, changing just the version byte…
No worries: PowerShell to the rescue!
## =============================================
## Author:      Gianluca Sartori - @spaghettidba
## Create date: 2012-11-07
## Description: Changes the version information
##              in the header of a SQL Server trace
## =============================================
cls

# Enter your filename here
$fileName = "somefile.trc"

# The version information we want to write: 0x0A = 10 = SQLServer 2008
[Byte[]] $versionData = 0x0A
# The offset of the version information in the file
$offset = 390

[System.IO.FileMode] $open = [System.IO.FileMode]::OpenOrCreate
$stream = New-Object System.IO.FileStream -ArgumentList $fileName, $open
$stream.Seek($offset, [System.IO.SeekOrigin]::Begin);
$stream.Write($versionData, 0, $versionData.Length);
$stream.Close()
This script overwrites the version byte in the trace file, which lies at offset 390, changing it from 11 to 10.
This way, even a huge 100 GB trace file can be converted in milliseconds, ready to be consumed by ReadTrace or Profiler.
Enjoy!
P.S.: I haven’t tried, but I guess it could work with previous versions. However, tracing is deprecated in SQL Server 2012 and I guess it doesn’t introduce many differences from the SQL Server 2008 trace file format. The same cannot be said for SQL Server 2005 and I suppose that the file wouldn’t open anyway in Profiler. Unfortunately, I don’t have a SQL Server 2005 around to test.
Convert a Trace File from SQLServer 2012 to SQLServer 2008R2
Recently I started using RML utilities quite a lot.
ReadTrace and Ostress are awesome tools for benchmarking and baselining and many of the features found there have not been fully implemented in SQLServer 2012, though Distributed Replay was a nice addition.
However, as you may have noticed, ReadTrace is just unable to read trace files from SQLServer 2012, so you may get stuck with a trace file you wont’ abe able to process.
When I first hit this issue, I immediately thought I could use a trace table to store the data and then use Profiler again to write back to a trace file.
The idea wasn’t bad, but turns out that Profiler 2012 will always write trace files in the new format, with no way to specify the old one. On the other hand, Profiler2008R2 can’t read trace data from a table written by Profiler2012, throwing an ugly exception:

Interesting! So, looks like Profiler stores version information and other metadata somewhere in the trace table, but where exactly?
It might sound funny, but I had to trace Profiler with Profiler in order to know! Looking at the profiler trace, the first thing that Profiler does when trying to open a trace table is this:
declare @p1 int
set @p1=180150003
declare @p3 int
set @p3=2
declare @p4 int
set @p4=4
declare @p5 int
set @p5=-1
exec sp_cursoropen @p1 output,N'select BinaryData from [dbo].[trace_test] where RowNumber=0',@p3 output,@p4 output,@p5 output
select @p1, @p3, @p4, @p5
So, looks like Profiler stores its metadata in the first row (RowNumber = 0), in binary format.
That was the clue I was looking for!
I loaded a trace file in the old format into another trace table and I started to compare the data to find similarities and differences.
I decided to break the binary headers into Dwords and paste the results in WinMerge to hunt the differences:
-- Break the header row in the trace table into DWords
-- in order to compare easily in WinMerge
SELECT SUBSTRING(data, 8 * (n - 1) + 3, 8) AS dword
	,n AS dwordnum
FROM (
	SELECT CONVERT(VARCHAR(max), CAST(binarydata AS VARBINARY(max)), 1) AS data
	FROM tracetable
	WHERE rownumber = 0
	) AS src
INNER JOIN (
	SELECT DISTINCT ROW_NUMBER() OVER (
			ORDER BY (SELECT NULL)
		) / 8 AS n
	FROM sys.all_columns AS ac
	) AS v
	ON n > 0 AND (n - 1) * 8 <= LEN(data) - 3
ORDER BY 2
If you copy/paste the output in WinMerge you can easily spot the difference around the 100th dword:

Hmmmm, seems promising. Can those “11” and “10” possibly represent the trace version? Let’s try and see.
Now we should just update that section of the header to let the magic happen:
-- Use a table variable to cast the trace
-- header from image to varbinary(max)
DECLARE @header TABLE (
	header varbinary(max)
)

-- insert the trace header into the table
INSERT INTO @header
SELECT binarydata
FROM tracetable
WHERE RowNumber = 0

-- update the byte at offset 390 with version 10 (SQLServer 2008)
-- instead of version 11 (SQLServer 2012)
UPDATE @header
SET header .WRITE(0x0A,390,1)

-- write the header back to the trace table
UPDATE tracetable
SET binarydata = (SELECT header FROM @header)
WHERE RowNumber = 0
The trace table can now be opened with Profiler2008R2 and written back to a trace file. Hooray!
Yes, I know, using a trace table can take a whole lot of time and consume a lot of disk space when the file is huge (and typically RML traces are), but this is the best I could come up with.
I tried to look into the trace file itself, but I could not find a way to diff the binary contents in an editor. You may be smarter than me a give it a try: in that case, please, post a comment here.
Using this trick, ReadTrace can happily process the trace file and let you perform your benchmarks, at least until Microsoft decides to update RML Utilities to 2012.
UPDATE 11/08/2012: The use of a trace table is not necessary: the trace file can be updated in place, using the script found here.
